The Burrow


Whether it’s an icebreaker at work, on a date, or you’re just getting to know someone, a great question to ask is “are you a dog person or a cat person?”
Dogs and cats are the most popular household pets and can bring great comfort to their owners. Different kinds of dogs and cats will appeal to different people – so there’s generally something for everyone.
As pet insurance experts, we wanted to learn more about dog people and cat people, how common pet ownership is, what motivates people to buy a pet, and why non-pet owners don’t have pets.
We ran a survey of more than 3,000 people in Australia, Canada and the USA to dig into what makes dog and cat people tick.
So sit back and enjoy these pawesome stats about mankind’s furry friends!


From the get-go it became clear that across all three nations surveyed, dogs have earnt their place as “man’s best friend.”
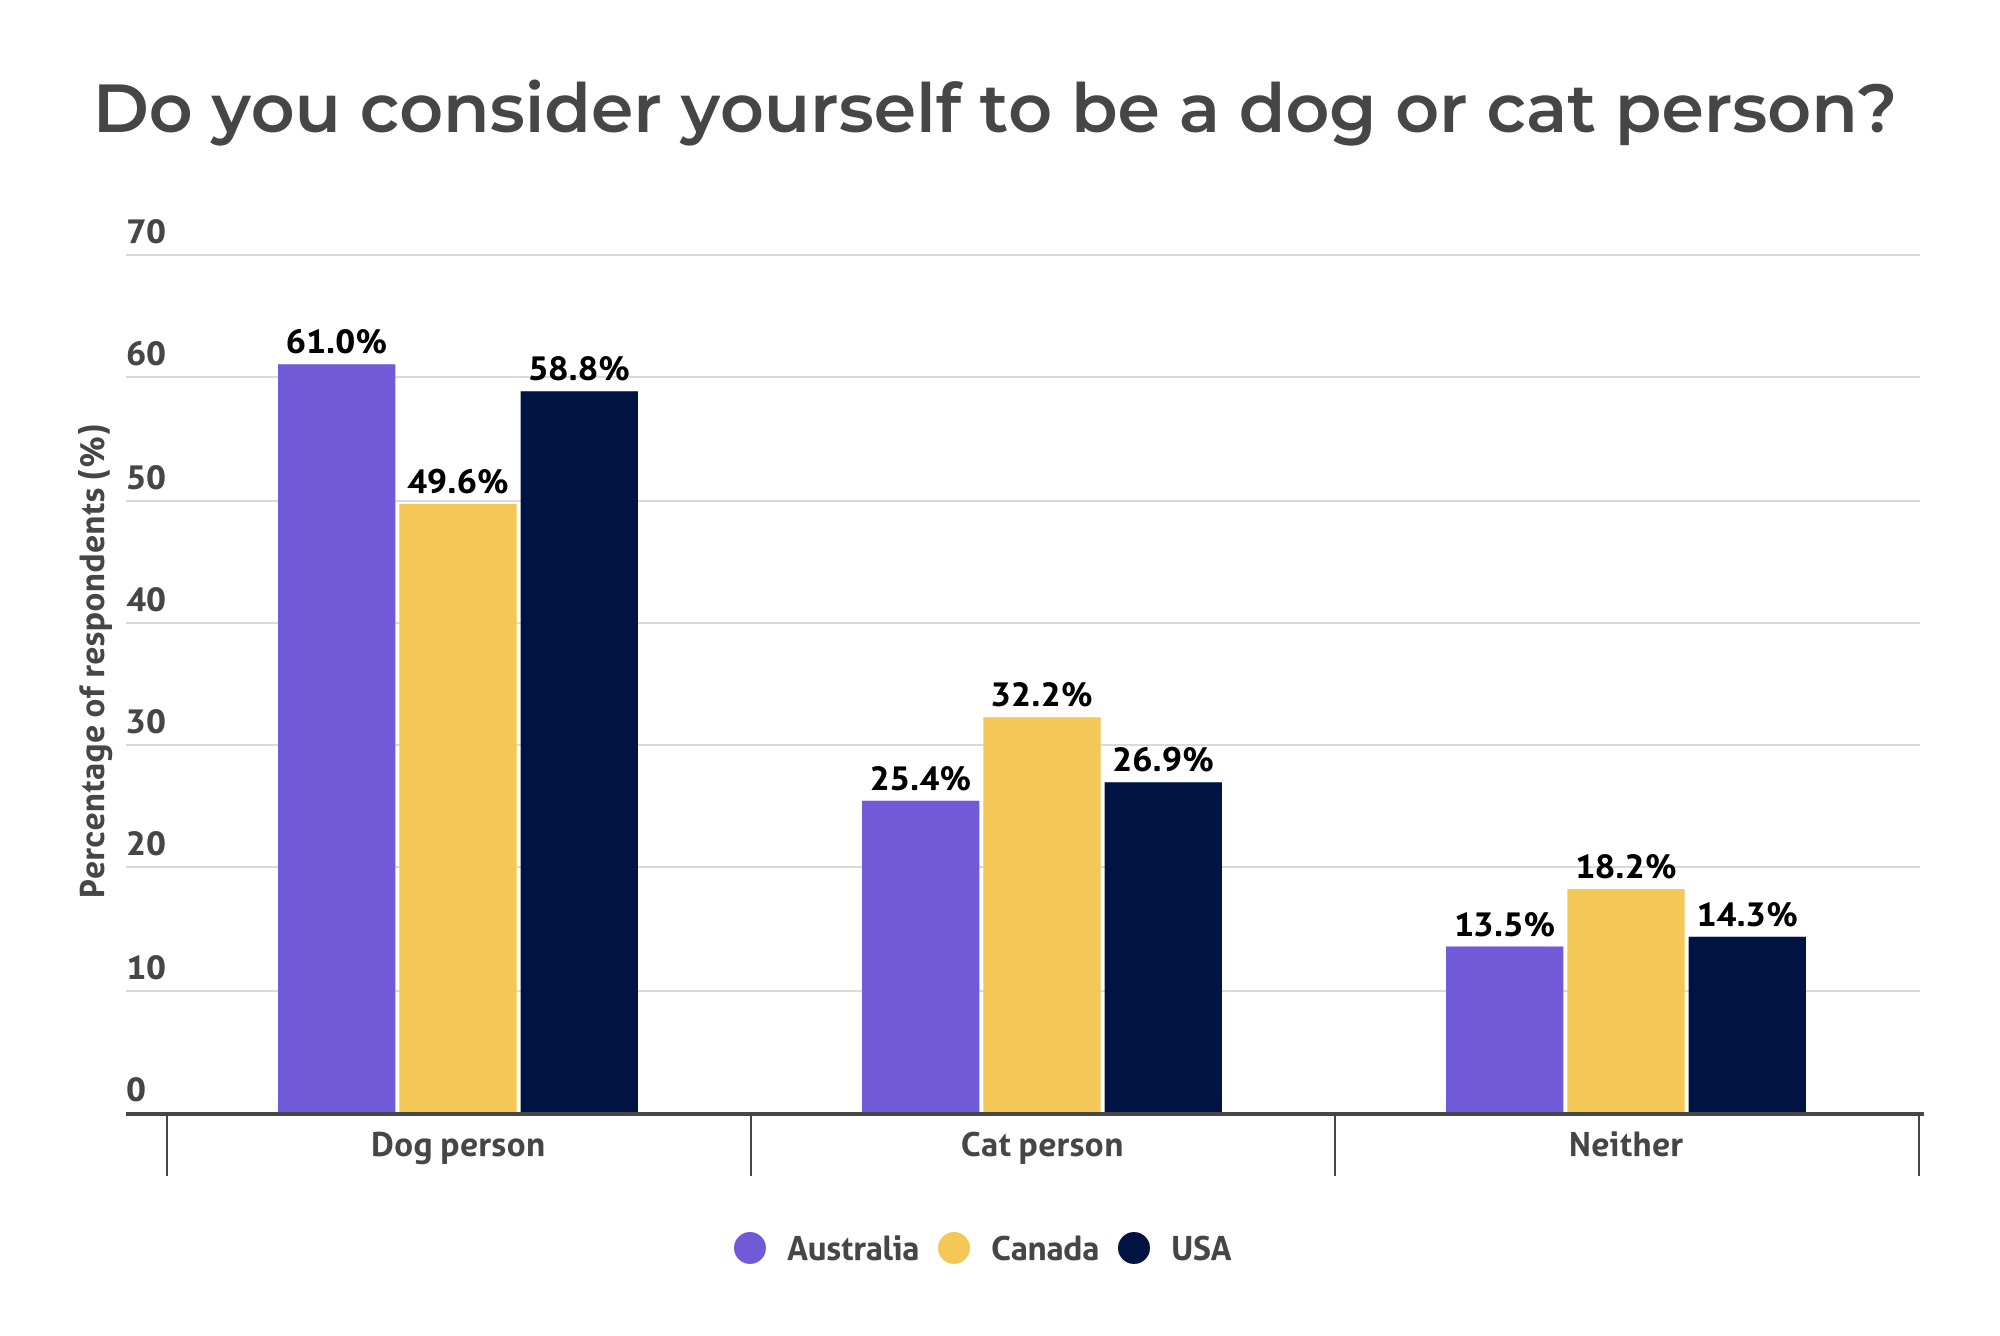
Over half of those surveyed said they considered themselves dog people. This was highest in Australia with 61.0% preferring canines over felines. The USA wasn’t far behind at 58.8%, while Canadians sat just below the halfway mark at 49.6%.
Canada had the highest percentage of cat people with roughly one third of respondents choosing cats over dogs, while in the US and Australia cat people made up one in four respondents. Canada also had the highest number of people who said they were neither, with 18.2% picking this option compared to 14.3% of Americans and 13.5% of Australians.


While not everyone can own a pet, for those that do, dogs were again the number one choice.
America had the highest number of dog owners with 55.9% saying they currently had a canine companion, followed by Australia at 49.6% and Canada at 41.9%. Interestingly, Australia had the highest response for ‘other animal’ with one-in-ten saying they owned pets besides cats or dogs.
| Which type of animal do you own? | Australia | Canada | USA |
| Dog | 49.6% | 41.9% | 55.9% |
| Cat | 30.8% | 34.2% | 35.8% |
| Other animal | 10.8% | 7.8% | 8.4% |
| None | 30.2% | 34.1% | 24.7% |
It is of course completely possible for cats and dogs to coexist, though the proportion of people who have both a cat and a dog is much lower than those who own one or the other. But hey, if you can’t decide, “why don’t we have both?”
In the USA, out of all those who owned at least one pet, 23.6% owned both a cat and a dog. In Canada it was 19.5%, while Australia had the lowest number of people with both a feline and canine companion at just 15.3% of pet owners surveyed.

There were some clear trends and a few interesting differences when we broke the data down for men and women and different age groups.
Across all three countries, women were more likely to be cat people than dog people (29.9% vs 20.7% in Australia, 34.5% vs 29.7% in Canada, and 29.5% vs 24.2% in the USA). Men were more likely to not own any pets compared to women, but interestingly there were slightly more Australian men than women who owned a dog (50.5% vs 48.9%).
When breaking the response up by age group, there was a clear trend where older generations were more likely than younger generations to say they were cat people, or neither – though dogs were still the number one choice – except in Australia. While older generations of people surveyed in Australia were more likely to say they were neither a cat or a dog person, the preference for cats declined alongside dogs, rather than rising as it did in Canada and the USA.

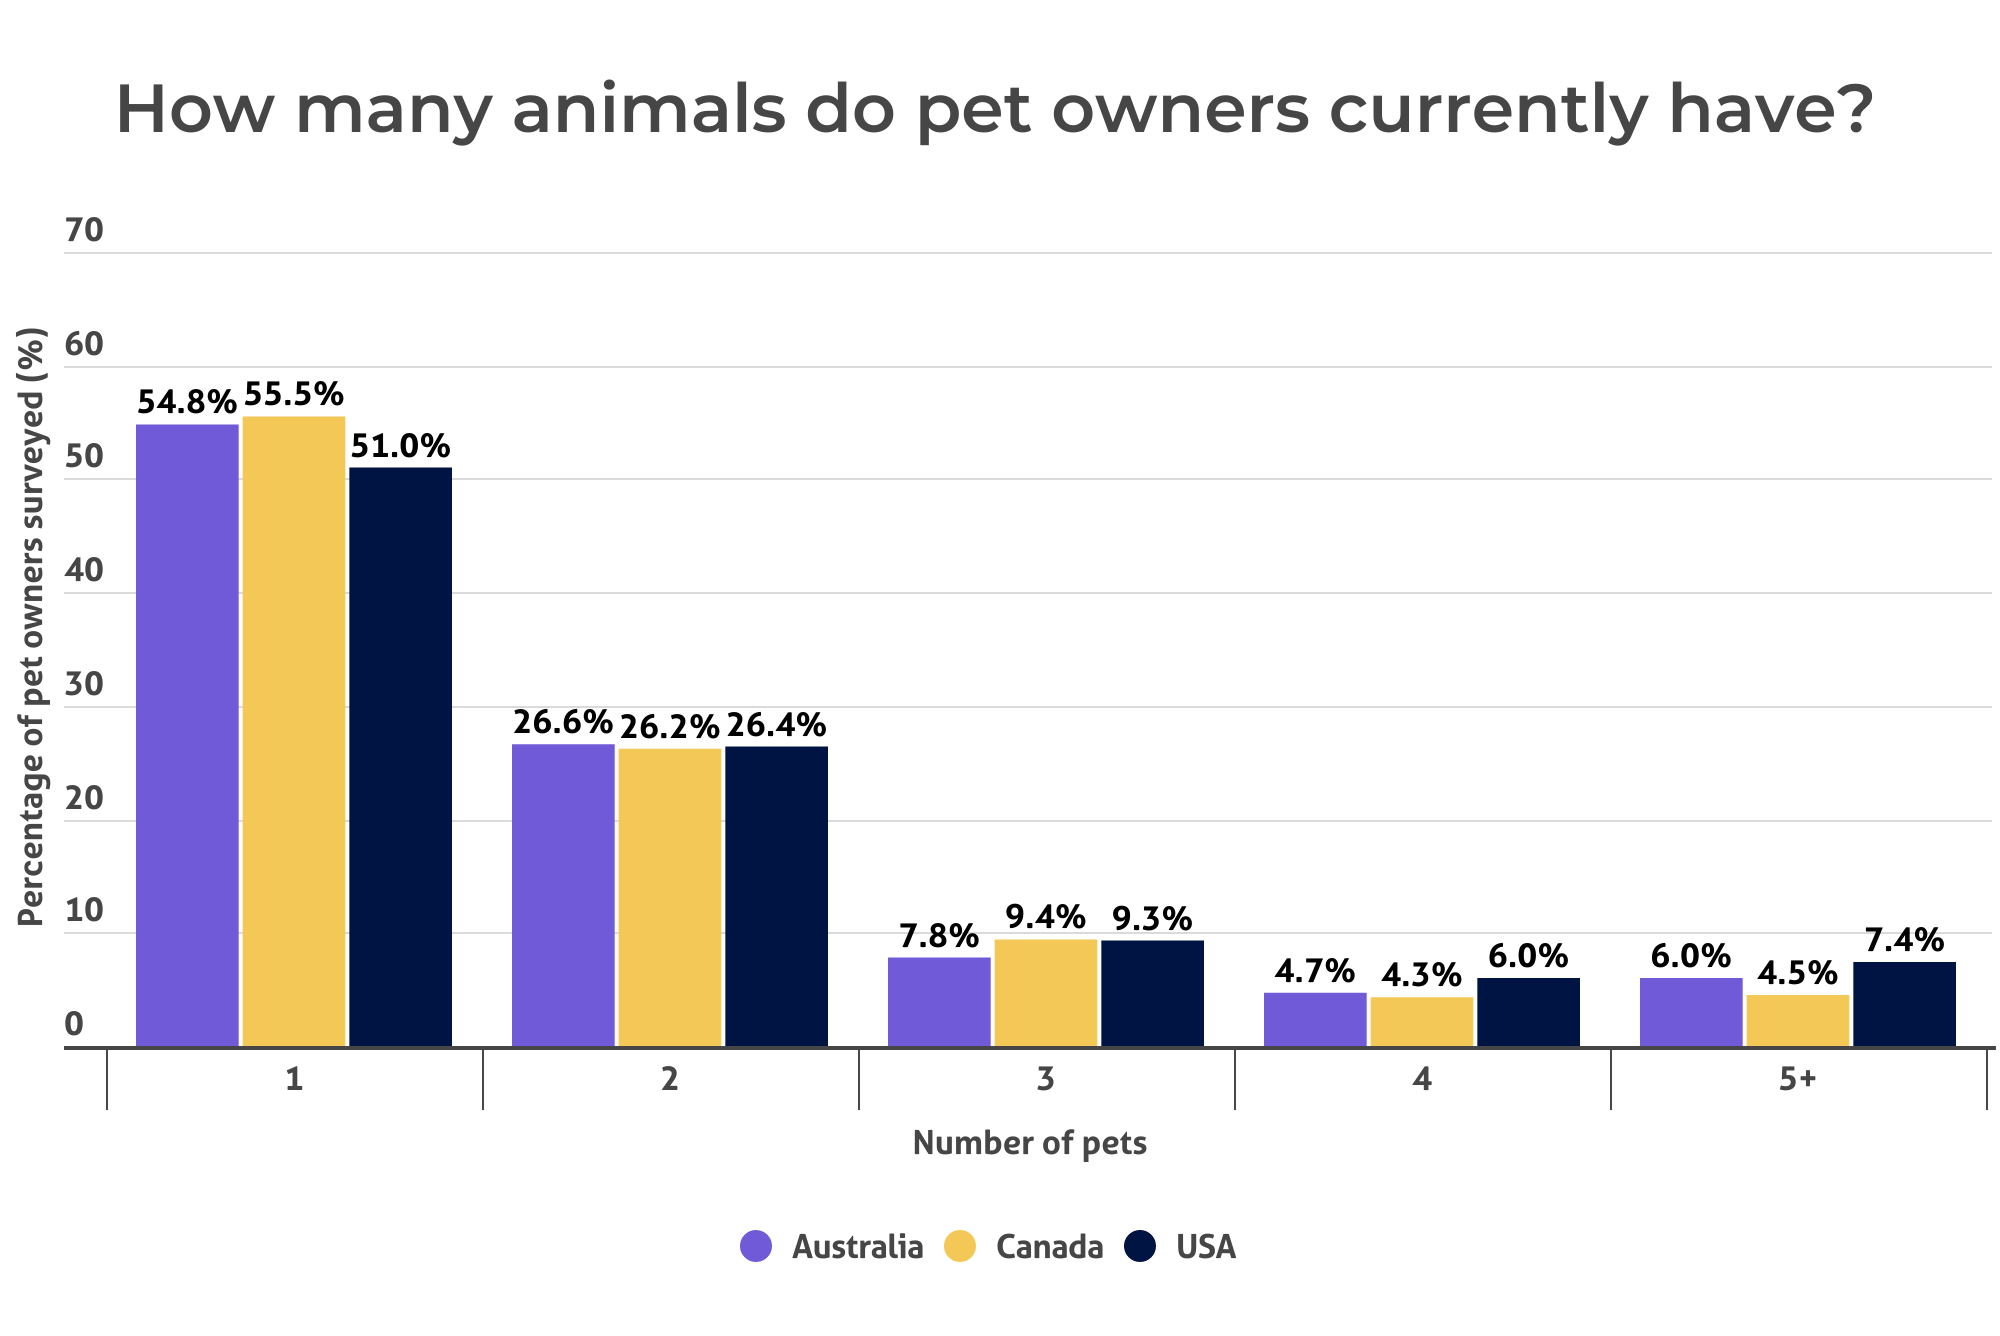
For those who do own a pet, the vast majority own just one – and this is true for every nation surveyed. Generally, half of pet owners have just one pet, while another quarter of pet parents own two pets. Interestingly, Americans had the highest proportion of people who owned five or more pets at 7.4% of pet owners surveyed, followed by 6.0% of Australian pet owners and 4.5% of Canadian pet owners.

The survey also asked people whether they had owned any pets previously in their lifetime. For the most part, people who currently own a pet had owned a pet before. The number of first-time pet owners in Canada and Australia was the same at 20.8% – roughly one-in-five pet owners. In the USA it was slightly lower at 17.5%.

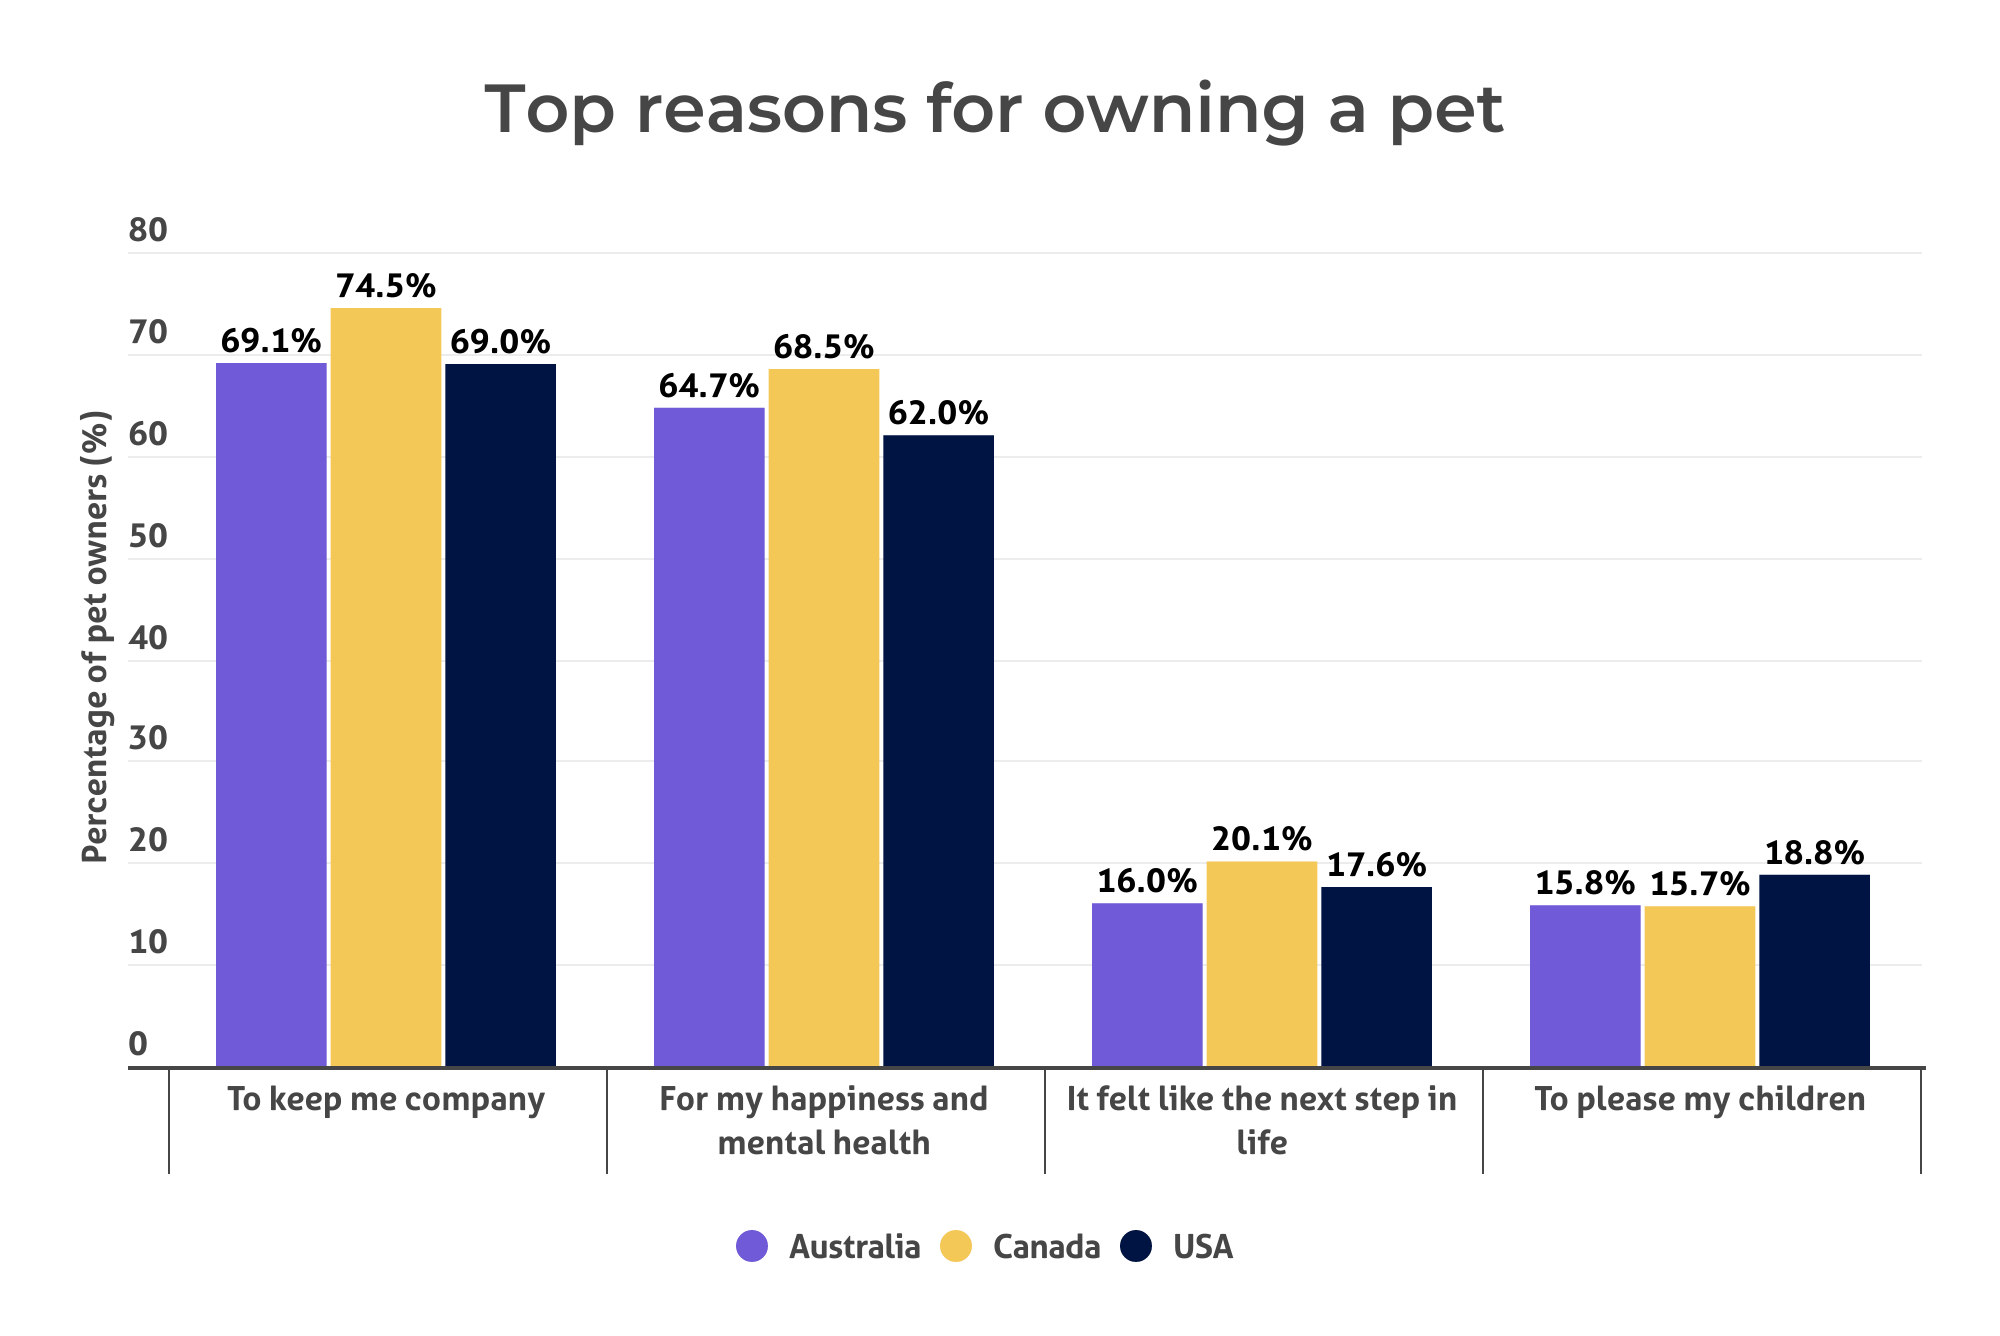
A big part of the survey was asking, “why do you own a pet?” Respondents were able to select multiple different reasons based on which ones applied to them. The chart below showcases the top four reasons for owning a pet.

The top three reasons were exactly the same for pet owners in Australia and Canada. American pet owners shared the first two motivations but had “to please my children” above “it felt like the next step in life.”
This consistency across all three countries changes when the answers are broken down based on whether pet owners have a cat or a dog.
In Australia, the top motivation for dog owners was company, but the top one for cats was to contribute to happiness and mental health. They swapped answers for the second-most common motivation, while the third-most popular choice was quite different for cat and dog owners. Australian cat owners had “please my children” as the third-most nominated motivation, while dog owners said it felt like next step in life and the right thing to do.
In Canada, the answers were all the same regardless of whether the respondent owned a cat or dog, while in the States the first two reasons were the same, but the third reason was different. The third reason for dog owners was to please their children, while the third-biggest reason for cat owners was actually “I don’t know why I got my pet”.


Regardless of the reason or why people buy pets, most people aren’t actively looking for a new one, based on the results for current pet owners and those without a pet.
In Australia, only 13.4% of people were currently looking for a pet. In Canada it was 15.6%, and in the USA, 20% of people were looking for a new pet. Interestingly, when the statistics were broken down by gender:

As lovable as pets are, they aren’t for everyone, and not everyone who wants to have a pet is able to. There are many different reasons why people might not have a cat, dog or any other pet.
For all three countries, the number one reason was the same: people’s living situation prevents them. For Australians and Canadians without a pet, the second-biggest reason was not having the time to properly care for one. For Americans, the second-biggest reason was cost.
Interestingly, when the responses were broken down by generation, the primary reason was quite different for reach age group, in all three countries.
| Country | 18-25-year-olds | 26-41-year-olds | 42-57-year-olds | 58+ year-olds |
| Australia | Living situation | Don’t have time | Can’t afford it | Go away too much |
| Canada | Can’t afford it | Don’t have time | Living situation | Don’t have time |
| USA | Can’t afford it | Don’t have time | Can’t afford it | Don’t have time |

Pets can get ill, hurt or injured, and the cost of their care can get expensive. Pet insurance can help cover this cost help make veterinary care affordable and give pet owners peace of mind.
Compare the Market’s General Manager of General Insurance, Adrian Taylor, explains further.
“Pet insurance in Australia can generally cover up to 70-90% of a vet bill, covering a range of specific illnesses and accidental injuries. Some higher levels of cover also help cover routine benefits such as vaccinations,” says Taylor.
“It helps you take care of your pet by covering part of your eligible bills, making essential care for your loved one more affordable.”
Compare the Market commissioned PureProfile to survey 1,006 Australian, 1,012 Canadian 1,003 American adults in September 2023.
In the article where the statistics are analysed by gender, respondents who identified as neither male nor female were not included due to low numbers. These respondents and their answers were included in other analysis.
