This winter has been an especially chilly time for Aussies, causing us to crank our heaters up and insulate the household. With many trying to stay warm, our increased energy usage may see electricity bill prices increase by $117.70 to $298.261 in winter vs summer.
We surveyed 1,000 Australians across the country to understand general energy consumption habits once the temperature drops. Interestingly, the survey showed that over a third (34%) of respondents admitted they wouldn’t proactively reduce their energy usage around the house this winter, despite the cost of electricity involved.
Instead, it’s the unfortunate truth that many of us will avoid heating this winter to mitigate costs, so much so that close to a third (30%) of Australians will only use the heater once a week to avoid a high bill.2
In Greater Brisbane, the coldest days on average were a mild 21 degrees Celsius.3 Apart from Brisbane, four-person households in de-regulated capital city markets* (where customers can choose their electricity company) increased their electricity usage in winter vs summer in 2017.
* The average tariff is calculated from single rate electricity tariffs available to each city on Compare the Market’s comparison service and are correct as of 4 June 2019, but are subject to change.
“There are so many short and long-term tricks to save on your energy bills, yet it appears to be a decision of comfort over cash flow for two fifths of Aussies who don’t avoid the heater at all in winter and are happy to cop a higher energy bill,” explains our money expert, Rod Attrill.
Top five questions to ask yourself to prevent energy bill-shock
The cost of your electricity bill can be an unpleasant surprise when it’s more expensive than expected. However, there are a number of ways to keep costs down. Asking yourself these five questions can help reveal areas where there’s room for improvement.
1. Do you know your electricity usage habits in winter vs summer?
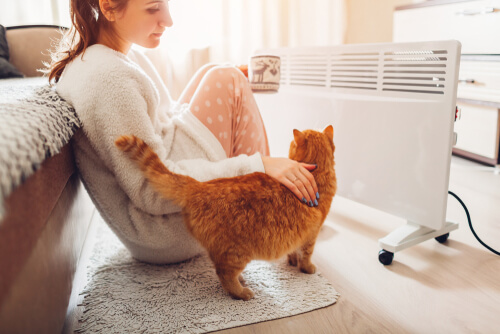
During winter, we tend to hibernate, which can often mean more time and money spent at home, and on your power bills.
In 2017, a four-person household in Sydney and surrounding areas experienced a $298.26 bill increase in winter, compared with summer usage. Keeping your use of appliances down during winter moderate, especially when it comes to heating, could help bring these costs down.
2. How energy efficient is your heater?
The type of appliance you use to heat your home can affect your power bill. Forty per cent of Aussies said they doubled their air conditioning unit as a heater. However, this appliance could be inefficiently heating your home if you haven’t chosen the right size or capacity for your property.4
In contrast to these results, a quarter of people opt for a gas heater, and with gas prices rising,5 heating their homes could become more costly. For example, the average annual cost to heat a large space (around 60m2) in Melbourne is approximately $440 using a four-star reverse-cycle split system air conditioner, and approximately $625 for a five-star energy gas heater.6
Increasing our energy usage in winter to keep warm means you might face some energy bill-shock vs summertime. The price difference could be in the hundreds, so make sure you fully understand the energy efficiency of your household appliances.
Having the correct heating and cooling unit for your home vs using the wrong one can make a massive difference to your electricity usage in winter and summer. Making sure the appliance is also more energy efficient will also help save on your energy usage.
3. Do you change your pool or spa maintenance?
Your pool or spa pump accounts for roughly 18 per cent of your power bill, so try to reduce your running time for potential savings over winter – but be careful not to compromise on water quality.7 A well-fitted pool cover may help reduce water and heat loss, as well as help minimise maintenance costs.8
We often overlook our pools and swimming in wintertime due to the cold temperatures, but this can have a big impact on the cost of our electricity bills.
4. Is the appliance switched off at the wall?
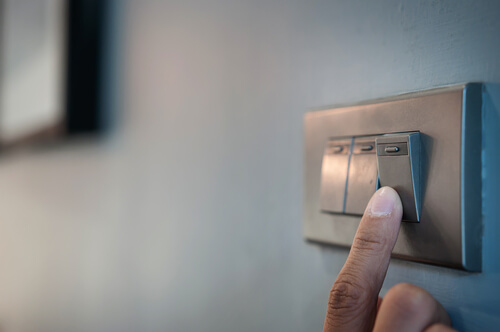
Over half of Australians (53%) admitted that they leave their appliances on standby rather than turning them off at the wall. A further quarter (29%) were not aware that appliances on standby are responsible for up to 10 per cent of costs on a power bill.9 This could lead to potential savings of $152.20 annually.10
5. How does your energy bill compare?
Electricity tariffs vary across regions within Australia’s states, and so does our energy usage in the winter vs the summer months. How does your energy usage compare vs the average four-person household across Australia’s capitals?
| Locations | Average tariff | Summer example usage (kWh) and cost | Winter example usage (kWh) and cost | Difference |
| Adelaide and surrounds | 39.34 c/kWh | 1,412 kWh – $555.48 | 1,751 kWh – $688.84 | +$133.36 |
| Melbourne and surrounds | 27.12 c/kWh | 1,304 kWh – $353.65 | 1,738 kWh – $471.35 | +$117.70 |
| Sydney and surrounds | 30.28 c/kWh | 1,580 kWh – $478.42 | 2,565 kWh – $776.68 | +$298.26 |
| Brisbane and surrounds | 26.55 c/kWh | 1,868 kWh – $495.95 | 1,583 kWh – $420.29 | -$75.66 |
| Canberra and surrounds | 23.43 c/kWh | 1,292 kWh – $302.72 (1,740 kWh with underfloor heating – $302.72) | 2,114 kWh – $495.31 (4,509 kWh with underfloor heating – $1056.46) | +$192.59 (+$753.74) |
Example of a four-person household’s energy consumption in 2017 throughout summer and winter11. Excluding Western Australia, North Queensland and the Northern Territory, which are only served by one state/territory-owned energy company. Tasmanian residents can choose from various energy retailers but the prices are capped. The average tariff is calculated from single rate electricity tariffs available to each city on Compare the Market’s comparison service and are correct as of 4 June 2019, but are subject to change. N.B. The electricity plans and tariffs you have access to are based on location, and you may find that the average single rate tariff in your area is higher or lower than the one used in the table above. Additionally, depending on your energy plan and which periods of the year you’re charged. for, your bills might include usage from both the summer and winter months. | ||||
Fortunately, there is some positive news. From 1 July, customers on a standing offer could save an average of $171 in South Australia, $181 in NSW and $118 in south-east Queensland, when default market offers (DMOs) come into effect.12 A Victorian Default Offer (VDO) could also see Victorian consumers potentially saving from $310 to $450 annually.13
However, market offers are often cheaper than DMOs,14 and there can also be lower-cost offers available to choose from over the new VDOs.15 This means a lot of households can save further by auditing bills and switching suppliers using an energy comparison service like ours.
Sources
[1] Locations and electricity usage in summer and winter from Energy Consumption Benchmarks: Electricity and Gas for Residential Customers. ACIL Allen Consulting. 2018.[2] Pure Profile survey, June 2018
[3] Bureau of Meteorology Greater Brisbane in winter 2017: http://www.bom.gov.au/climate/current/season/qld/archive/201708.brisbane.shtml
[4] Energy Star Rating – Air conditioners: http://www.energyrating.gov.au/products/space-heating-and-cooling/air-conditioners
[5] Australian Government Department of the Environment and Energy Heating and Cooling https://www.energy.gov.au/households/heating-and-cooling
[6] Sustainability Victoria Heating approximate costs per year, based on an average existing (pre-2005) two-star house in a Melbourne climate, heating to 20 degrees celsius all day on the weekend (7am to 10pm) and in the morning (6am to 9am) and evening (5pm to 11pm) on weekdays, as needed. Based on an electricity tariff of 31.9c/kWh. Gas tariffs are based on a declining block structure, which means the unit cost of gas decreases as gas use (or area being heated) increases. Gas tariffs used for room heating: 12m2 – 2.75c/MJ; 30m2 – 2.64c/MJ; 60m2 – 2.45c/MJ: https://www.sustainability.vic.gov.au/You-and-your-home/Save-energy/Heating/Heating-running-costs
[7] Your home household appliances and equipment: http://www.yourhome.gov.au/energy/appliances
[8] Northern Territory Government Department of Land Management Swimming Pools & Water Use: https://denr.nt.gov.au/__data/assets/pdf_file/0005/269330/WaterResNT_Factsheet_Swimming-Pools-CA.pdf
[9] Energy Australia – How standby power is affecting your bill: https://www.energyaustralia.com.au/blog/better-energy/how-standby-power-affecting-your-bill
[10] Australian Energy Market Commission Final report 2018 – Residential Electricity Price Trends December 2018, page 33. Calculation based on a 10 per cent discount based on the annual bill for the national average representative consumer in 2017-18 is $1,522 inclusive of GST: https://www.aemc.gov.au/sites/default/files/2018-12/2018%20Price%20Trends%20-%20Final%20Report%20-%20CLEAN.PDF
[11] Locations and electricity usage in summer and winter from Energy Consumption Benchmarks: Electricity and Gas for Residential Customers. ACIL Allen Consulting. 2018.
[12] Australian Energy Regulator- AER issues Default Market Offer decision (April 2019): https://www.aer.gov.au/news-release/aer-issues-default-market-offer-decision
[13] Electricity and gas retail markets review implementation 2018 (Victorian Default Offer) https://www.esc.vic.gov.au/electricity-and-gas/inquiries-studies-and-reviews/electricity-and-gas-retail-markets-review-implementation-2018/electricity-and-gas-retail-markets-review-implementation-2018-victorian-default-offer
[14] Australian Energy Regulator- AER issues Default Market Offer decision (April 2019): https://www.aer.gov.au/news-release/aer-issues-default-market-offer-decision
[15] Victoria State Government Environment, Land, Water and Planning The Victorian Default Offer makes electricity bills fair https://www.energy.vic.gov.au/victoriandefaultoffer


