The Burrow

Jun 19, 2024
Saving is crucial. However, amid cost-of-living pressures, it can be challenging to save money – and some may even need to dip into their bank account.
As experts in helping Australians compare income protection insurance – which could cover a portion of employees’ pay in the event of an accident or illness – we sought to understand savings habits, debt and how long the average person can theoretically live without an income.
To do this, we surveyed a nationally representative sample of more than 3,000 people across Australia, the United States, and Canada.
These are the results.
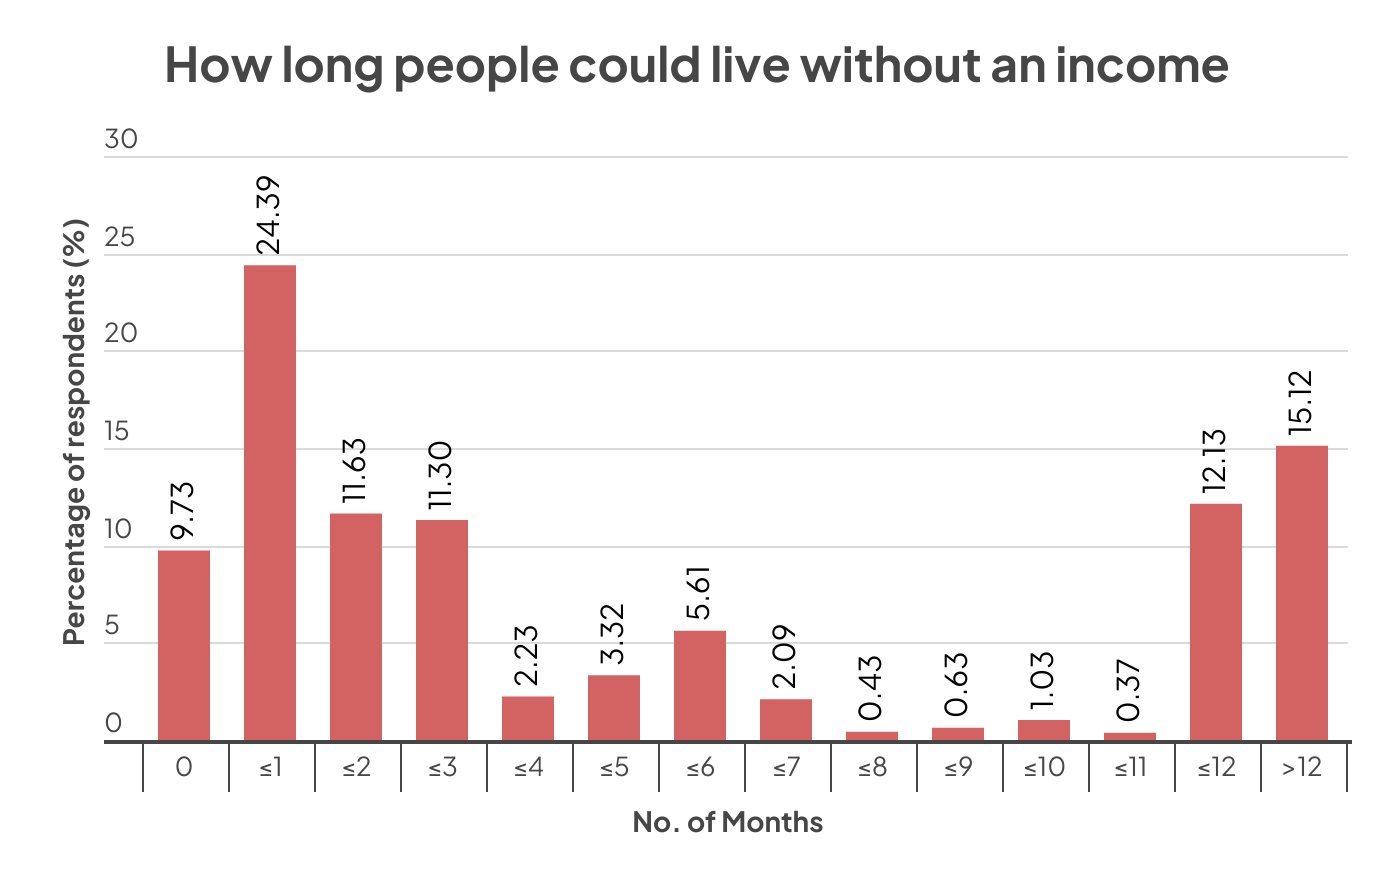
Each month includes all weeks within. Percentages were rounded to the nearest two decimal places.
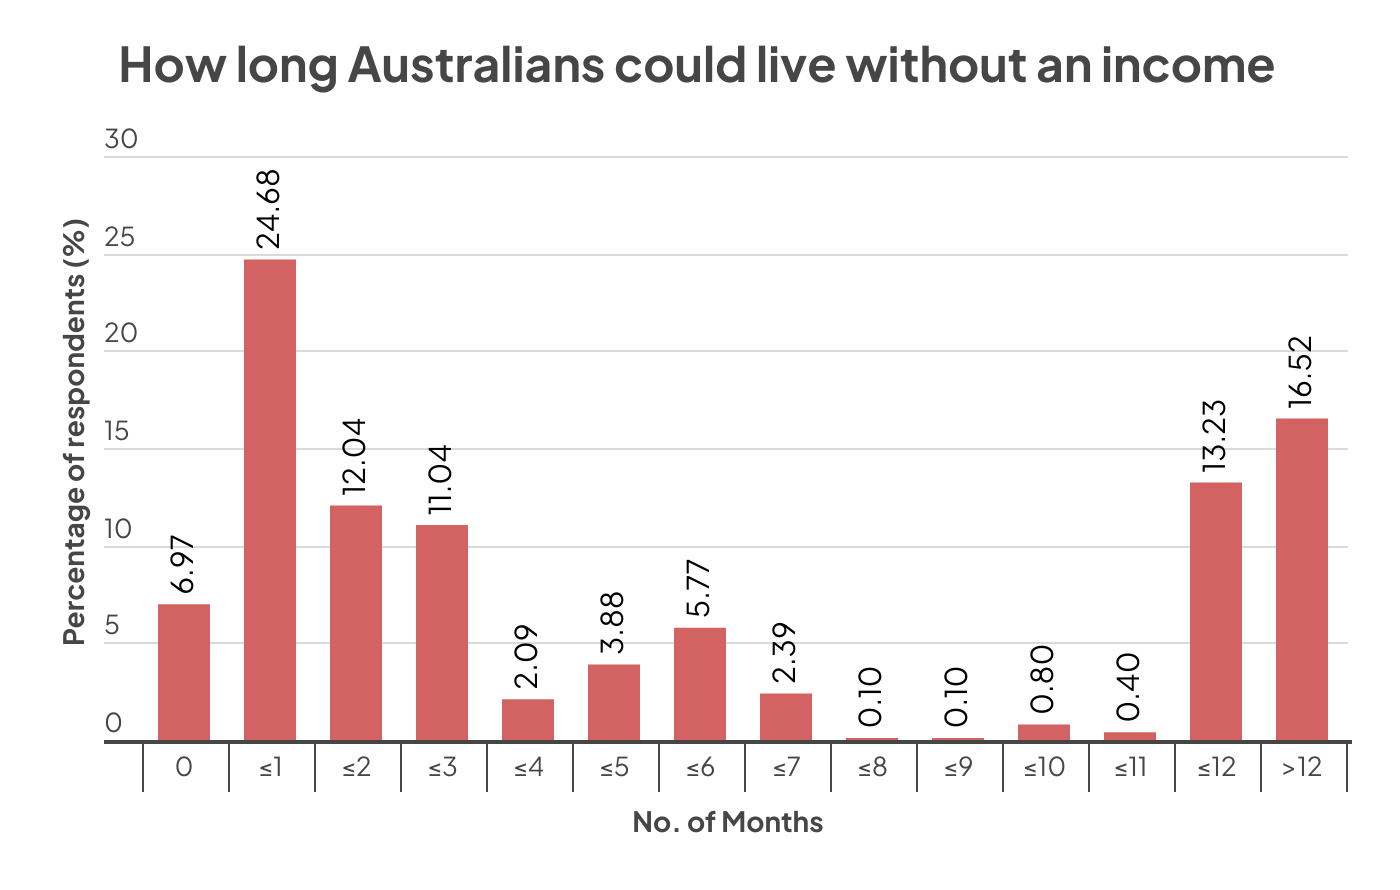
Each month includes all weeks within. Percentages were rounded to the nearest two decimal places.
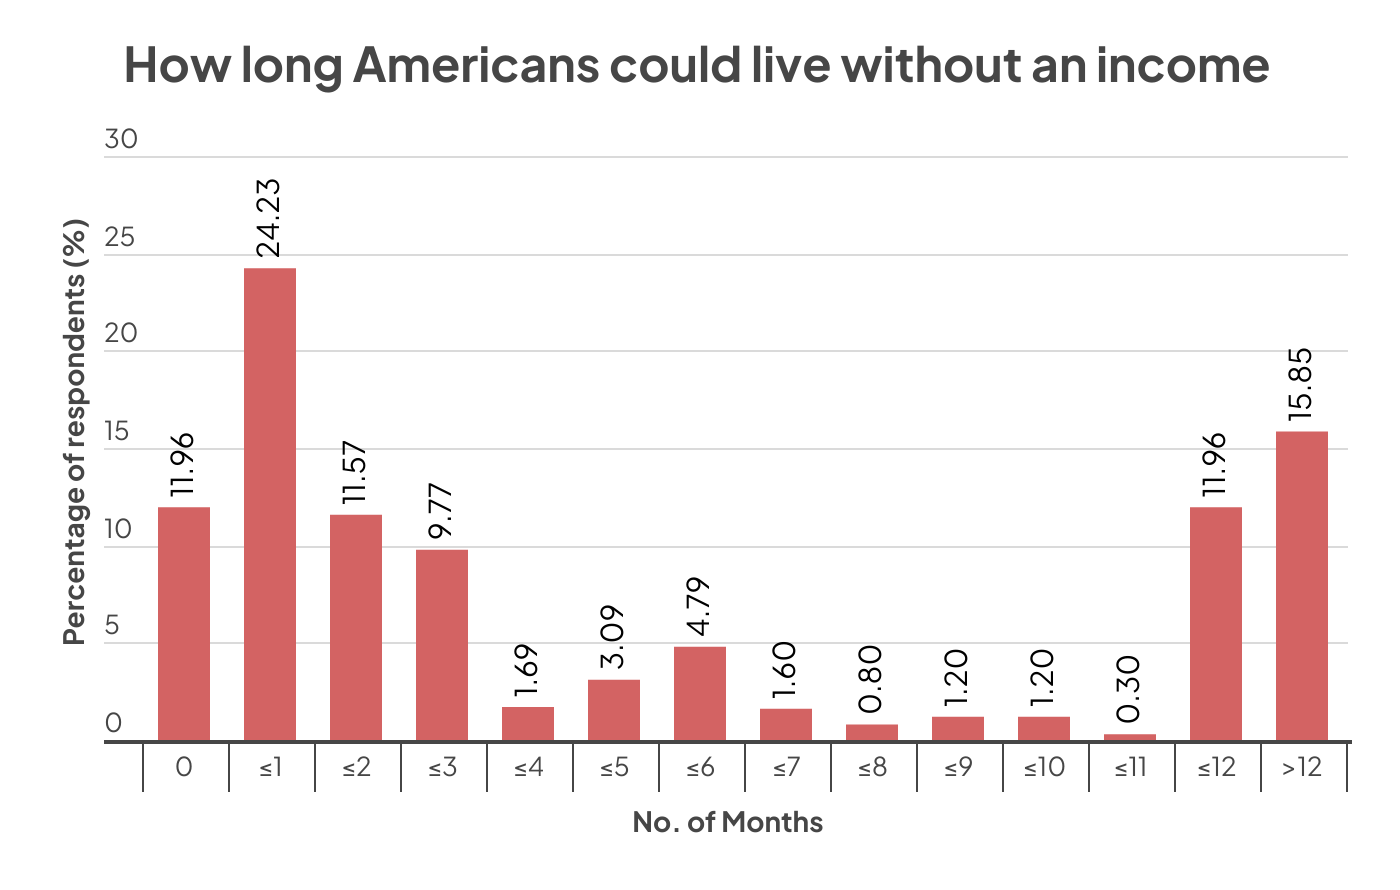
Each month includes all weeks within. Percentages were rounded to the nearest two decimal places.
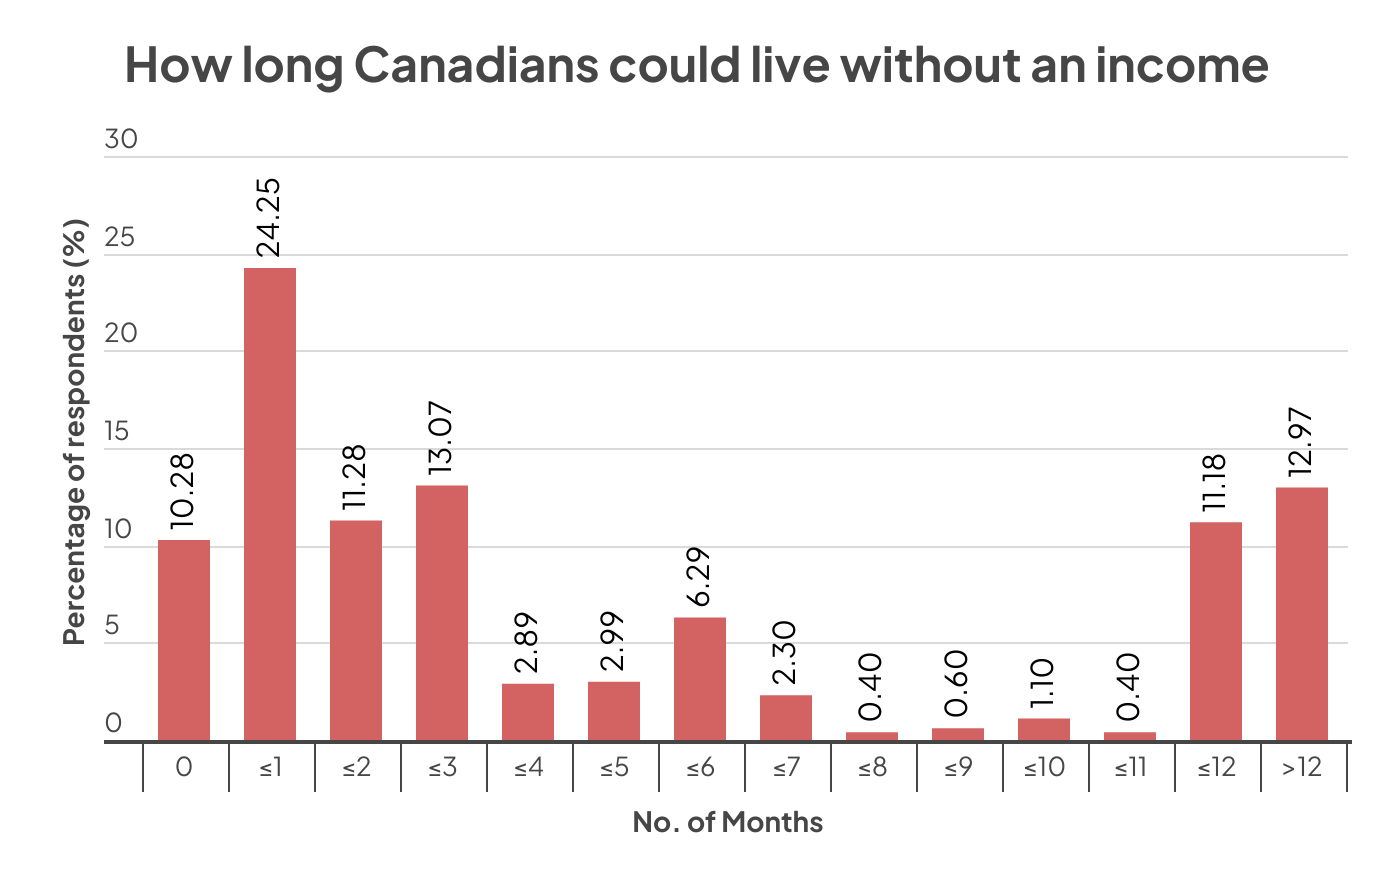
Each month includes all weeks within. Percentages were rounded to the nearest two decimal places.
Combined, one-in-10 participants (9.73%) admit to being unable to maintain their lifestyle immediately if they lost their job or ability to work.

According to our nationally representative study of Australians, Americans and Canadians, nearly a quarter (24.39%) said they can maintain their lifestyle for one month or less based on their current savings, while only 11.63% claim they can last for two months or less.
Nearly one-in-six respondents (15.12%) said they could solely survive on their savings for more than one year.
The average Australian said they can maintain their lifestyle for at least 16 weeks if they lost their job or ability to work.
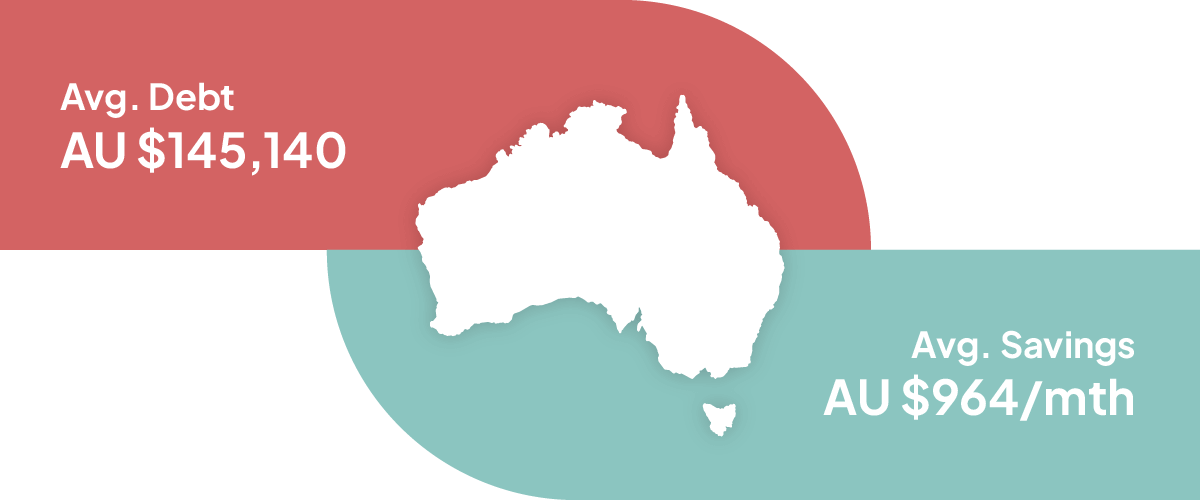
Australians have the highest amount of debt compared to Americans and Canadians, according to our nationally representative sample. The survey – which covered all debt including student loans, home loans, personal loans, and buy now pay later debt – found Australia’s national average debt sits at AU$145,140 (US$93,935).
This is double of Americans’ debt – with key drivers likely including the Australian Government’s Higher Education Loan Program (HELP) for tertiary students, in addition to policies that have encouraged home loans, investment properties, car loans, and credit cards.1
However, the average Australian puts AU$964 (US$624) into savings per month – which is on par with Americans.
About a quarter (24.18%) of Australians claim to dip into their savings once each month on average – led by and younger Generation Z 18- to 25-year-olds (27.61%).
Of the adults surveyed who have children, 15.48% admitted having used or prevented their child’s savings in order to save money for themselves.
The average American can last for at least 16 weeks if they lost their job or ability to work.
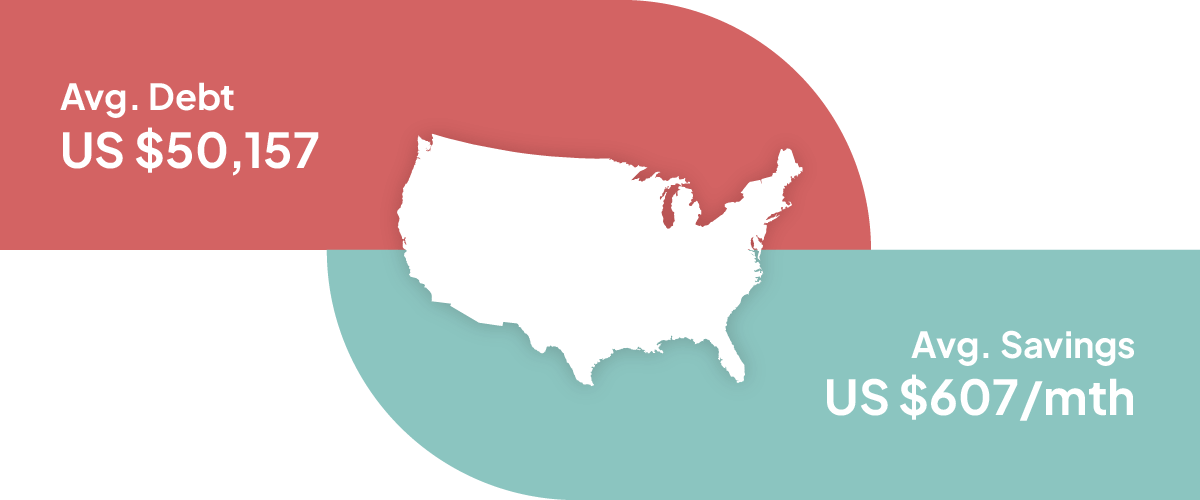
The United States sits in the middle for savings and debt compared to Australia and Canada. Nationally on average, Americans claim to add US$607 in savings each month.
Meanwhile, the average debt is US$50,157, which is nearly half the amount of Australians but is still about a quarter more than Canadians.
One-in-five Americans (19.84%) claimed to typically use their savings once each month, mainly from 26- to 41-year-olds (37.62%).
Meanwhile, more than one-in-10 (11.82%) adults who have children said they have dipped or prevented their child’s savings in the past.
The average Canadian claimed they can live for up to 25 weeks if they lost their job or ability to work.
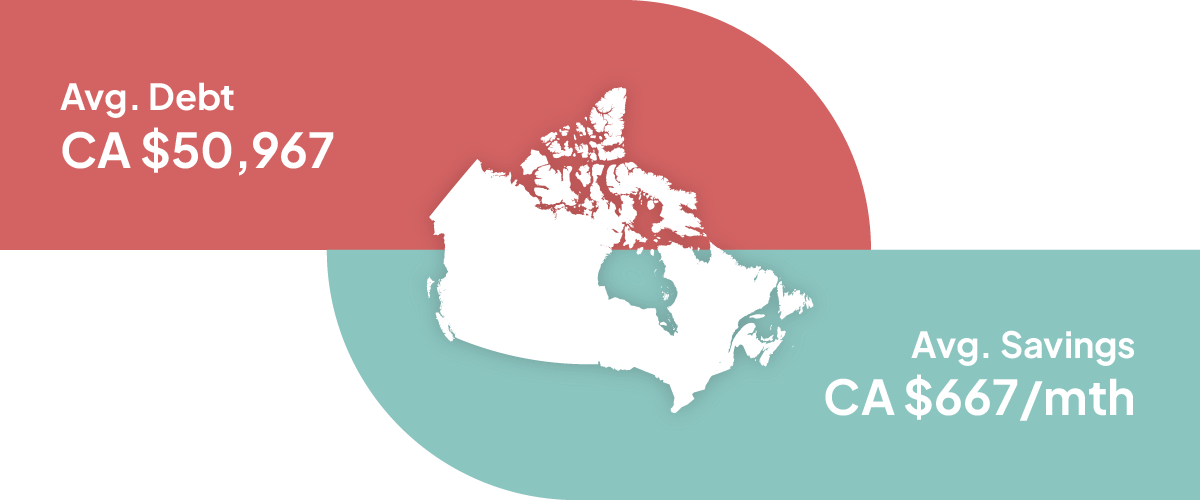
Canada boasts the lowest average debt and highest savings habits out of all three major developed countries we surveyed. Canadians claimed they typically put CA$667 (US$748) into savings per month – which is up to a quarter more than Americans and Australians.
However, the national average debt was CA$50,967 (US$37,032) – which is 26.17% lower than the USA and a substantial 60.58% lower than Australia.
Nearly a quarter of Canadians admitted to dipping into their savings once each month (23.45%), with 26- to 41-year-olds (33.35%) and Gen Z 18- to 25-year-olds (30.57%) most likely to use their savings.
One-in-eight Canadians who have children (12.54%) said they have dipped or stopped their child’s savings in order to help themselves save.
Despite cost-of-living financial challenges, there still ways to save money:
However, in the event of an unexpected accident or sudden illness that prevents you from working, Compare the Market Australia’s Executive General Manager of Health, Life and Energy, Steven Spicer, said income protection insurance could help.
“Income protection can insure for up to 70 per cent of your income through monthly benefits if you’re unable to work because of an injury, illness or certain medical conditions,” Mr Spicer said.
“These payments could help maintain your quality of life and continue to pay essential bills while you’re off work and getting back on your feet.
“However, not every policy is the same with different insurance premiums, exclusions, benefit periods and what percentage of your income could be covered, so it pays to compare and look for the right cover for you.”
Compare the Market commissioned PureProfile to survey a nationally representative sample of 1,005 Australians, 1,003 Americans, and 1,002 Canadians in February 2024.
Each month includes all weeks within (for example, ‘one month or less’ includes week one to four).
Monetary figures were rounded to the nearest whole number. Percentages were rounded to the nearest two decimal places.
Currency conversions to the United States Dollar (USD) were based on the exchanged rate as at 15 April 2024.
Additional sources: