The Burrow

A list of countries with an interest in renovation and refurbishment
Renovating a house is a great way to inject new life into a tired old home in need of an update, to make your living space truly your own. Planning a refurbishment is an opportunity to make your home even more comfortable and enjoyable for you and your family. It can improve the home’s sale value if you want to put it on the market, and though the actual works can be stress inducing – once its all done you can sit back and bask in the glory of your beautiful, refreshed abode.
This got us to thinking, is a home renovation more popular in some parts of the world than others?
To figure out whether renovation projects are equally loved around the world, or whether some nations are particularly passionate for it, the home loan experts at Compare the Market dug into Google search data for 50 different countries, using multiple renovation search terms, to see which country has the highest interest in home renovation.
The results are listed below and as it turns out; some nations are much more gung-ho about tearing into drywall than others.
Renovations have specific impacts on the value of a property, and many people renovate a home to sell soon after (commonly known as flipping). Whether you buy a home with the intention of flipping to sell, or you just want to renovate the place for yourself, it’s important to first ensure that your home loan best suits your circumstances.
You may need to allow for additional budget when funding your renovation plans. Whether you’re refinancing or taking out a mortgage for a new property in need of some TLC, comparing home loans can help you weigh up your options. Whether you want a redraw facility, off-set account, or are just looking for a competitive interest rate, comparing options can help you save time and find a loan option that meets your needs.
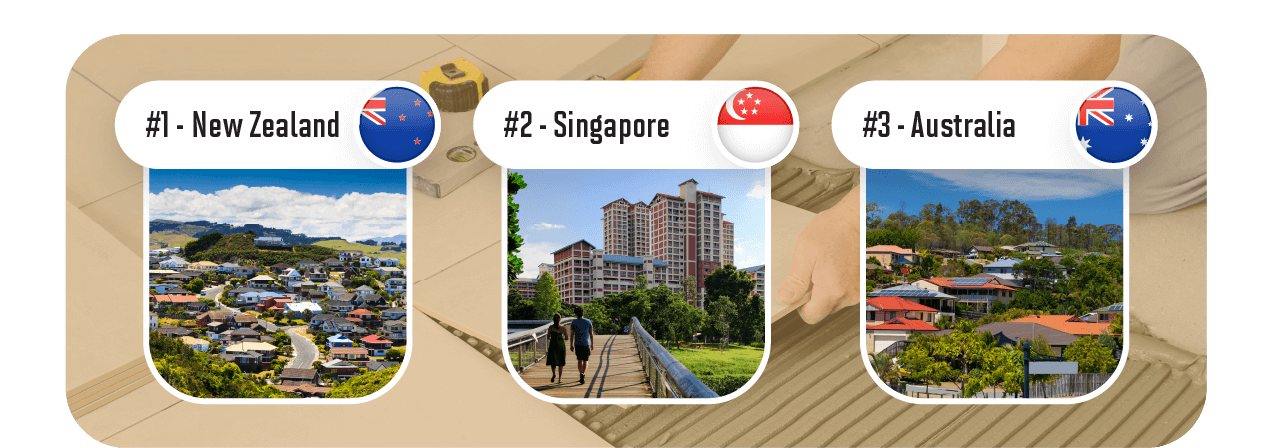
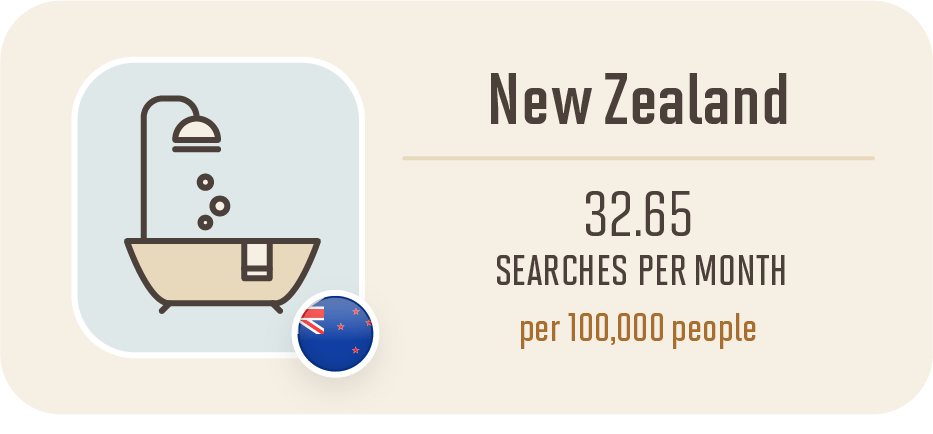
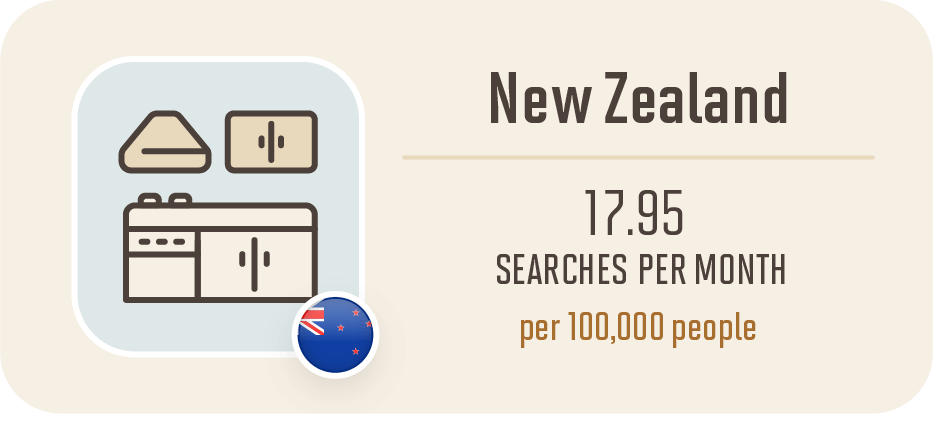
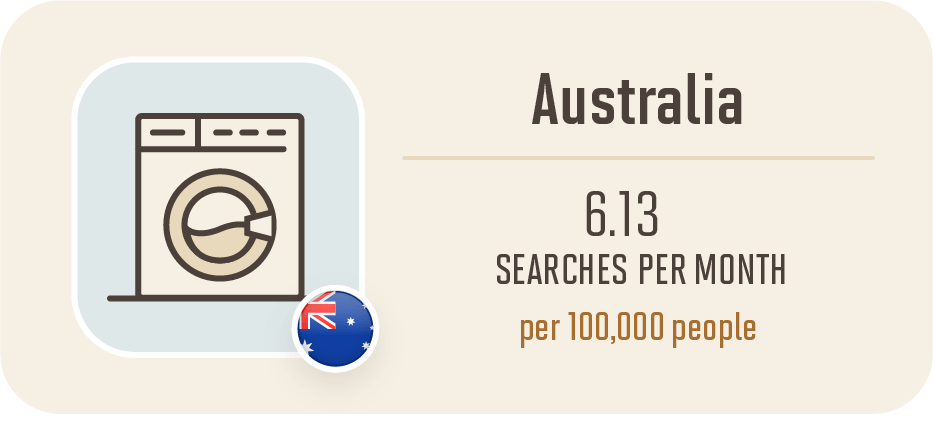
The country with the highest total search volume for the renovation phrases we looked at is New Zealand. New Zealand had the fifth-highest average monthly search volume for “renovation” with a per capita rate of 32.65 per 100,000 people, compared to Denmark which had the most at 50. However, New Zealand had a search volume per capita of 73.46 for the term “bathroom renovation” and 17.95 for “kitchen renovation”, both of which were the highest search volume rates for those terms. New Zealand also had the second-highest search volume for “laundry renovation” at 2.24, just behind Australia at 6.13.
House prices in New Zealand exploded after October 2020, but have started to dip since February 2022, suggesting that homeowners may be turning to beautifying their homes after buying in a hectic market.1 In the latest wellbeing survey by Stats NZ, 47.5% of those surveyed said that their home required minor repairs or maintenance, while 17.4% said the home required moderate work, and 4.7% said the home needed major repairs.2
The nation with the next-highest total monthly average search volume for renovation terms was Singapore. Singaporeans have very high interest in home restoration. They had the second-highest search volume for the term “renovation” with 49.15 searches per 100,000 people per month. Singapore also had the fourth-highest number of searches for “kitchen renovation” (12.20 per 100,000) and fifth-highest for “laundry renovation” (0.16 per 100,000).
Singapore’s high interest in renovation may be representing homeowners planning ahead, as construction costs have gone up and there aren’t enough workers to meet the current demand, leading to increased times to complete renovation projects.3
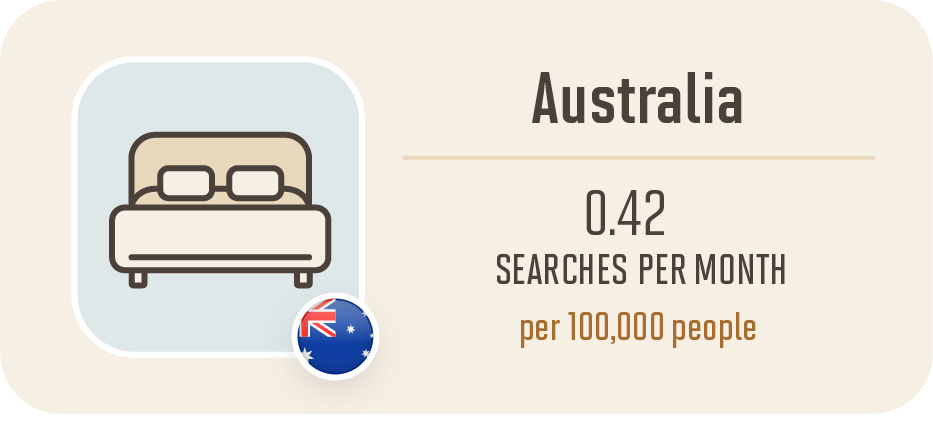
Rounding out the top three nations for interest in renovations is Australia. This is perhaps not too surprising given the long-running success of home renovation reality TV shows like The Block. The land down under had the fifth-highest search volume for “bathroom renovation” (20.68), second-highest for “kitchen renovation” (16.85 per 100,000), third-highest for “bedroom renovation” (0.42), plus the highest search volume for “laundry renovation” (6.13 per 100,000).
From 2019 to 2021, Australians spent more and more on renovations, partly due to the Australian Government providing grants for renovations to help prop-up the construction industry during the COVID-19 pandemic. In 2019, Australians spent AU$8.5 billion, then AU$9.2 billion in 2020 and AU$12.3 billion in 2021,4 with an overall spend increase of 44.7% over those three years.
New Zealand – 32.65 searches per month per 100,000 people
New Zealand – 17.95 searches per month per 100,000 people
Australia – 0.42 searches per month per 100,000 people
Australia – 6.13 searches per month per 100,000 people
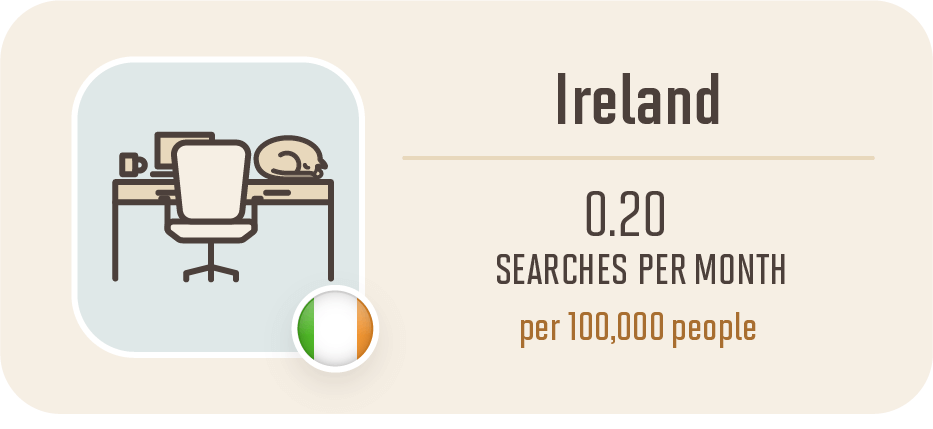
Ireland – 0.2 searches per month per 100,000 people
| Country | “renovation” search volume per capita | “bathroom” search volume per capita | “kitchen” search volume per capita | “bedroom” search volume per capita | “laundry” search volume per capita | “home office renovation” search volume per capita | Total average search volume for all terms |
| New Zealand | 32.65 | 73.46 | 17.95 | 0.20 | 2.24 | 0 | 126.53 |
| Singapore | 49.15 | 4.40 | 12.20 | 0.16 | 0.16 | 0.16 | 66.27 |
| Australia | 11.11 | 20.68 | 16.85 | 0.42 | 6.13 | 0.11 | 55.32 |
| Sweden | 9.80 | 28.43 | 12.74 | 0 | 0 | 0 | 50.98 |
| Denmark | 50.00 | 0.17 | 0.17 | 0.17 | 0 | 0 | 50.51 |
| Hong Kong | 47.36 | 0.13 | 0.13 | 0.13 | 0 | 0.13 | 47.89 |
| Ireland | 17.60 | 17.60 | 5.20 | 0.2 | 0.20 | 0.2 | 41.00 |
| Japan | 39.41 | 0.38 | 0.70 | 0.02 | 0 | 0 | 40.51 |
| Hungary | 10.41 | 25.00 | 1.77 | 0.20 | 0 | 0 | 37.39 |
| Canada | 11.45 | 11.45 | 11.45 | 0.23 | 0.02 | 0.13 | 34.76 |
| Greece | 18.44 | 15.53 | 0 | 0 | 0 | 0 | 33.98 |
| Czechia | 4.48 | 22.42 | 4.48 | 0.09 | 0 | 0 | 31.49 |
| Switzerland | 18.18 | 0.11 | 0.11 | 0.11 | 0.11 | 0 | 18.63 |
| Cyprus | 14.16 | 0.83 | 0.83 | 0 | 0 | 0 | 15.83 |
| UK | 7.88 | 4.23 | 3.50 | 0.16 | 0.01 | 0.02 | 15.82 |
| USA | 6.63 | 4.42 | 4.42 | 0.06 | 0.008 | 0.05 | 15.59 |
| Malaysia | 13.25 | 0.51 | 1.44 | 0.03 | 0.03 | 0.03 | 15.30 |
| Taiwan | 15.06 | 0.04 | 0.04 | 0.04 | 0.04 | 0 | 15.23 |
| Norway | 8.72 | 5.81 | 0.18 | 0.18 | 0 | 0 | 14.90 |
| Poland | 5.03 | 7.69 | 1.90 | 0.23 | 0 | 0 | 14.88 |
| Austria | 9.67 | 2.85 | 0.76 | 0 | 0 | 0 | 13.29 |
| UAE | 9.90 | 1.38 | 1.38 | 0.09 | 0.09 | 0 | 12.87 |
| France | 12.34 | 0.10 | 0.13 | 0.03 | 0 | 0.01 | 12.63 |
| Mexico | 11.24 | 0.007 | 0 | 0 | 0 | 0 | 11.25 |
| Germany | 9.65 | 0.03 | 0 | 0 | 0 | 0 | 9.69 |
| Finland | 8.57 | 0.17 | 0.17 | 0.17 | 0.17 | 0.17 | 9.46 |
| Belgium | 7.52 | 0.42 | 0.59 | 0.34 | 0 | 0.17 | 9.05 |
| Brazil | 4.59 | 2.50 | 0.88 | 0.27 | 0.01 | 0 | 8.27 |
| Philippines | 7.20 | 0.18 | 0.23 | 0.008 | 0.008 | 0.008 | 7.64 |
| Bolivia | 7.33 | 0 | 0 | 0 | 0 | 0 | 7.33 |
| South Africa | 3.12 | 2.13 | 1.18 | 0.01 | 0.01 | 0 | 6.48 |
| Turkey | 2.80 | 2.21 | 0.84 | 0.01 | 0 | 0 | 5.87 |
| Portugal | 4.75 | 0.69 | 0.19 | 0.09 | 0 | 0 | 5.74 |
| South Korea | 5.65 | 0 | 0 | 0 | 0 | 0 | 5.65 |
| Netherlands | 4.18 | 0.29 | 0.52 | 0.23 | 0.05 | 0.11 | 5.40 |
| Argentina | 5.21 | 0.02 | 0 | 0 | 0 | 0 | 5.23 |
| Spain | 5.13 | 0 | 0 | 0 | 0 | 0 | 5.13 |
| Vietnam | 2.92 | 0.01 | 0.01 | 0.01 | 0.01 | 0.01 | 2.97 |
| Indonesia | 1.57 | 0.35 | 0.31 | 0.25 | 0 | 0 | 2.50 |
| Ghana | 2.22 | 0.03 | 0.03 | 0 | 0 | 0 | 2.28 |
| India | 1.28 | 0.11 | 0.07 | 0.01 | 0.0007 | 0.0007 | 1.48 |
| Italy | 0.97 | 0.08 | 0.08 | 0.01 | 0.01 | 0.01 | 1.19 |
| Egypt | 0.94 | 0.009 | 0.009 | 0.009 | 0 | 0 | 0.96 |
| Pakistan | 0.82 | 0.06 | 0.004 | 0.004 | 0.004 | 0.004 | 0.90 |
| Algeria | 0.70 | 0.02 | 0 | 0 | 0 | 0 | 0.72 |
| Nigeria | 0.59 | 0.004 | 0.004 | 0 | 0 | 0.004 | 0.61 |
| Thailand | 0.51 | 0.001 | 0.001 | 0.001 | 0.001 | 0.001 | 0.52 |
| Ethiopia | 0.09 | 0.008 | 0.008 | 0 | 0 | 0 | 0.10 |
Compare the Market used SEMRush to get average monthly keyword search volumes for 50 countries from the past 12 months. The terms used were “renovation”, “bathroom renovation”, “kitchen renovation”, “bedroom renovation”, “laundry renovation”, and “home office renovation”. These average monthly keyword search volumes were then compared to the national population of each country, sourced from the United Nations Population Fund, and this provided a per capita search rate per 100,000 people.
All search volumes per capita were then added together, with the 50 nations ranked from the country with the highest total average monthly search volume per 100,000 people across all six search terms, to the lowest.
Where a country had insufficient data for a particular search term, they were given a search rate of 0 for the purpose of our calculations.
The search terms were translated into the local language of non-English speaking countries for the purpose of gathering monthly search volumes for the different online queries. The English terms were also used for these countries and whichever language led to the highest search volume was used.
1 Monthly house price index report: 15 November 2022. Real Estate Institute of New Zealand. 2022.
2 Wellbeing statistics: 2021. Stats NZ, New Zealand Government. 2021.
3 Home Renovation during COVID Pandemic in Singapore. Rezt n Relax. 2022.
4 Home renovation spending soars to $12b as locked-down Aussies extend, beautify their homes. Owen Jacques, ABC Sunshine Coast, Australian Broadcasting Corporation. 2022.