The Burrow


“Cost of living” – it’s a phrase we’ve grown sick of hearing over the past year.
For every rate hike and bill increase, there’s not just a financial cost but an emotional cost as well.
A single mother survives on one meal a day to ensure her children won’t go hungry.
A young professional couple cannot afford to buy their first home because rising prices constantly outpace their deposit.
Pensioners struggle to make ends meet, faced with surging medical costs and exorbitant insurance premiums.
These are just some of the stories from the 3,000 Australians surveyed in Compare the Market’s Household Budget Barometer, our annual pulse check on how people are coping with the cost of living.
The findings paint a bleak picture of the one in five people for whom unrelenting price pressure and growing debts are a constant burden.
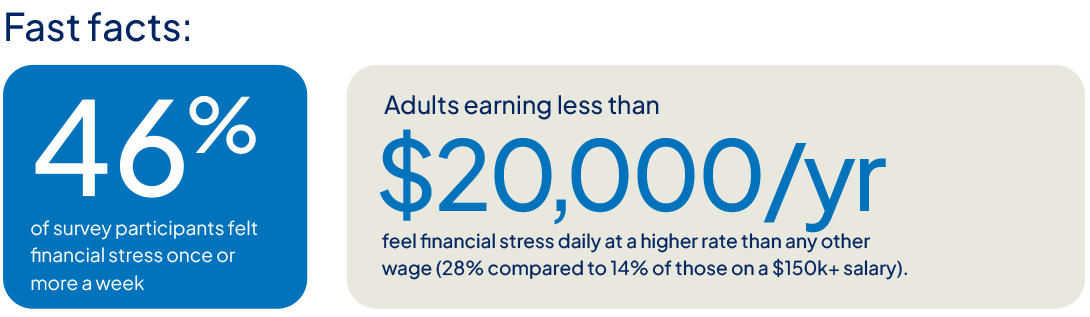
It is startling that most respondents (62%) felt financial stress once or more a month. Hundreds of people said they struggled to meet regular financial commitments, with 7% behind on bill payments, 5% in mortgage arrears and 9% in debt to their family.
But the pressure isn’t evenly spread. People earning $150,000+ were more likely to say they were better able to maintain or grow their savings and were less likely to feel stressed about their financial situation.
Mortgage stress was the biggest concern for high-income earners, while low-income earners struggled the most with everyday necessities such as power bills and groceries.
Not everyone can earn a better salary or take on a side hustle to make extra cash. Many feel helpless as the bills pile higher and the debts plough deeper.
But rather than resign to the fact that costs are going up, we need to start questioning, ‘why?’. Because while these costs may be considered essential, we shouldn’t assume there is always a good reason for a price rise.
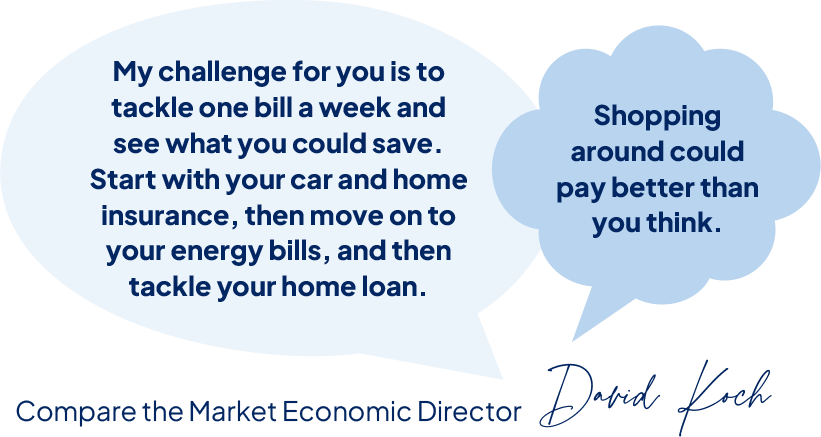
We should be fighting back. Yet one in four people hadn’t compared any bills to save over the past 12 months. Your loyalty to a brand could be costing you more than you think.
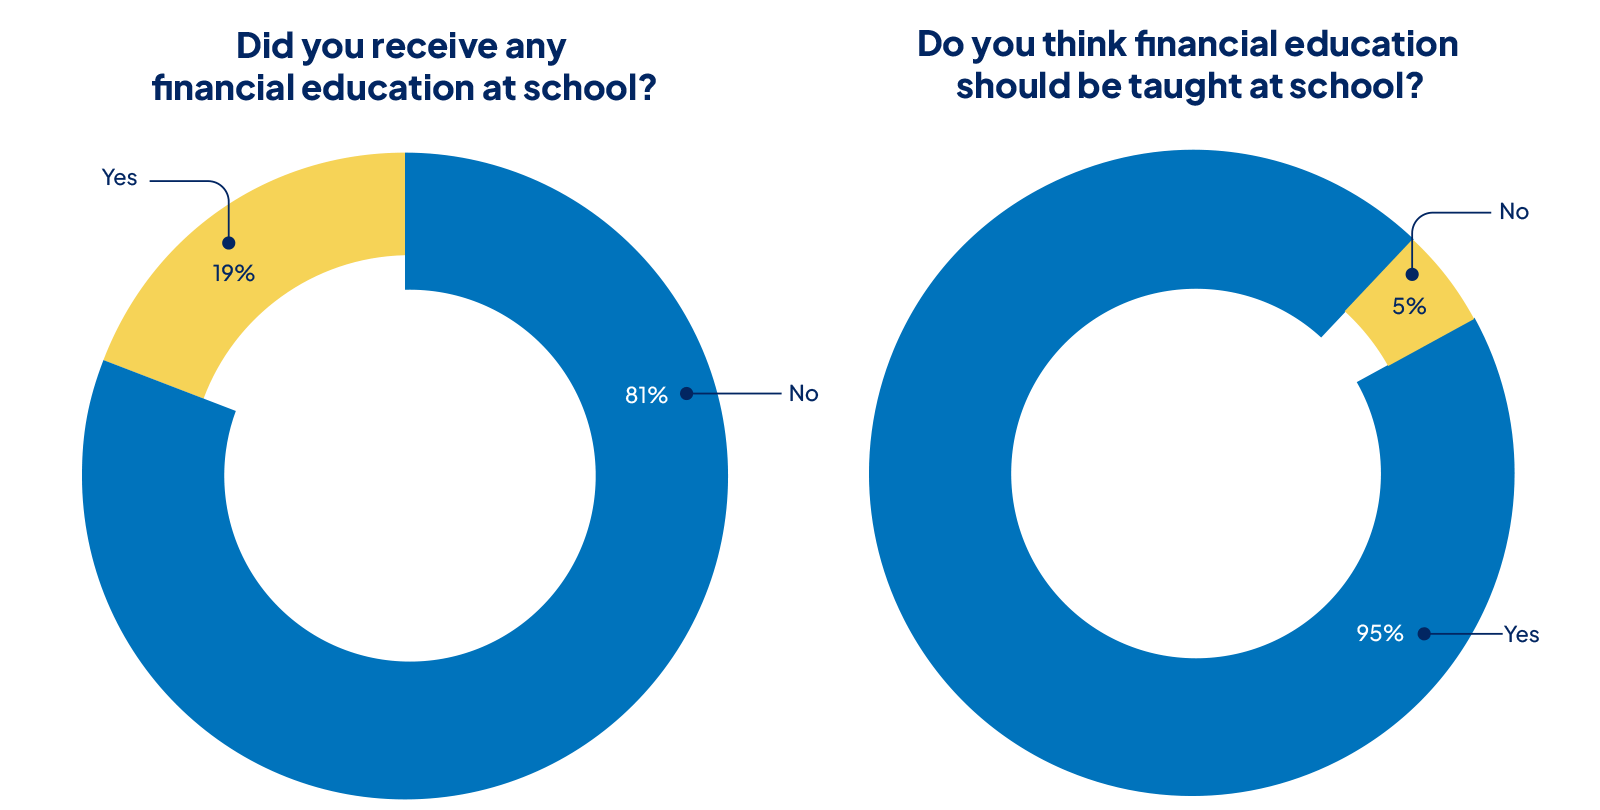
Which is why we’re calling for some primary financial skills, like managing and comparing bills, to be taught in all Australian schools. Nearly everyone we surveyed (95%) said they thought financial education should be included in the school curriculum, but only 19% said they had received any such education themselves.
It’s time we put power back into peoples’ hands, because we should never take a bill hike lying down. When loyalty doesn’t get rewarded, it pays to compare.
Compare the Market Economic Director

The cost of living crisis affects us all in different ways. Here’s what price pressure looks like for five different Australians.


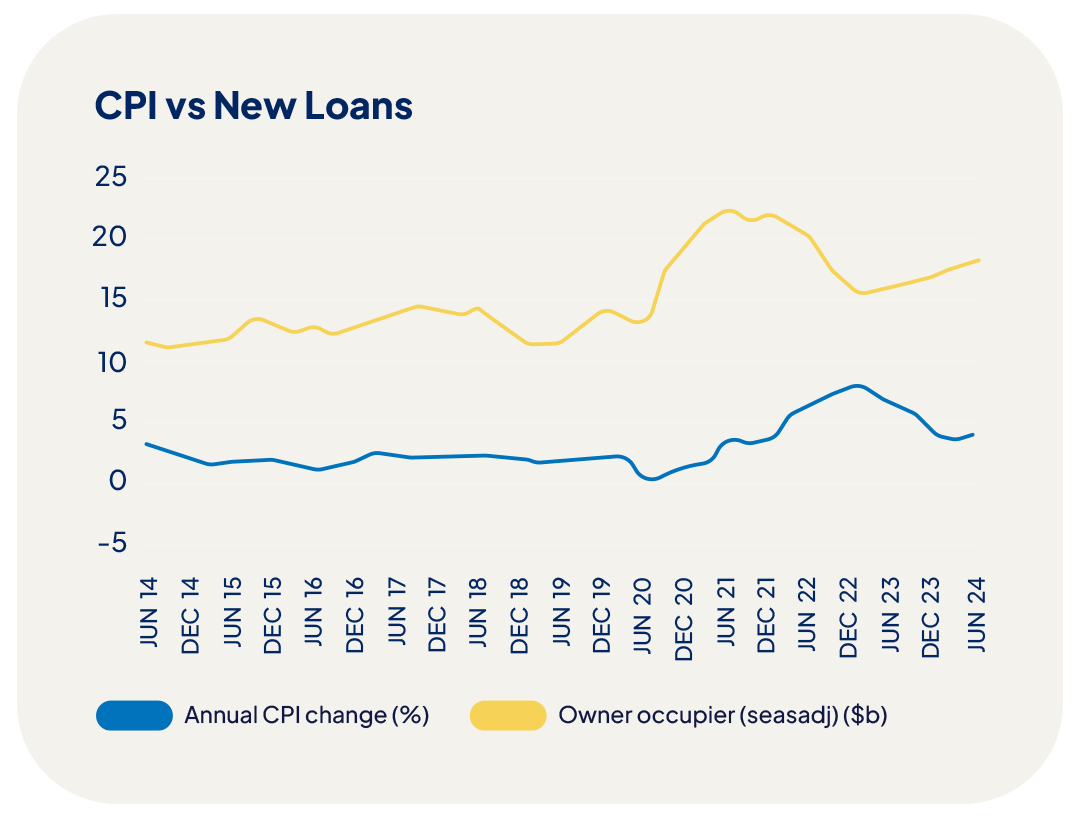
Over the twelve months to the June 2024 quarter, the Consumer Price Index rose 3.8%.
Inflation has been above the Reserve Bank of Australia’s (RBA) target range of 2-3% for 11 consecutive quarters (as of August 2024).
Experts say inflation won’t return to the target range until mid-2025, meaning Australian households may have to fork out more for essentials like groceries, fuel, electricity and insurance.
This prolonged period of high inflation, combined with higher interest rates has put a squeeze on homebuyer’s borrowing power. New loan commitments have reduced as a result.
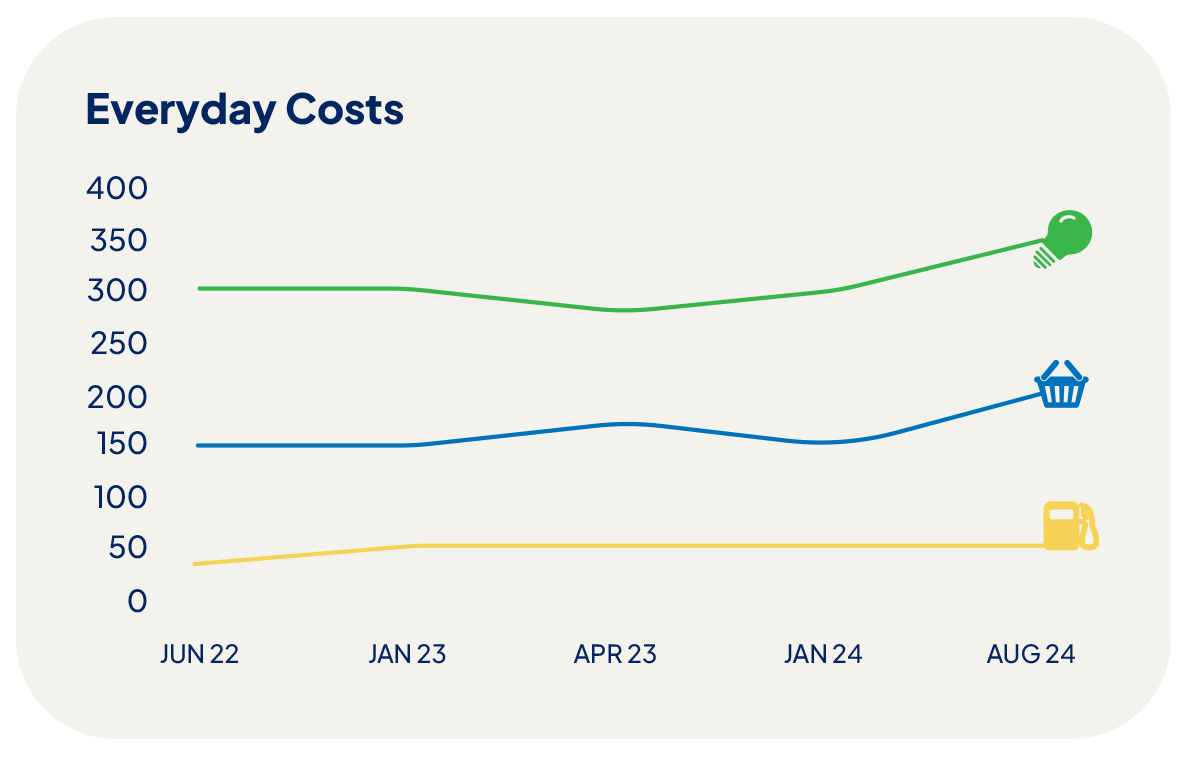
The median grocery spend was $200 in August 2024, compared with $150 in January 2024. That’s a 33% rise in just six months. The increase could be in part due to some Australians choosing to cook more at home and dine out less.
Meanwhile quarterly electricity bills increased from $300 to $350 in the eight months to August 2024. The bill shock pain may be delayed for some households while government energy rebates continue to cushion the blow. Conversely spending on petrol remained largely unchanged after a steep rise reported in early 2023.
Compare the Market has tracked insurance quote pricing for a four-bedroom home and a Toyota Corolla in five of the Australian capitals.
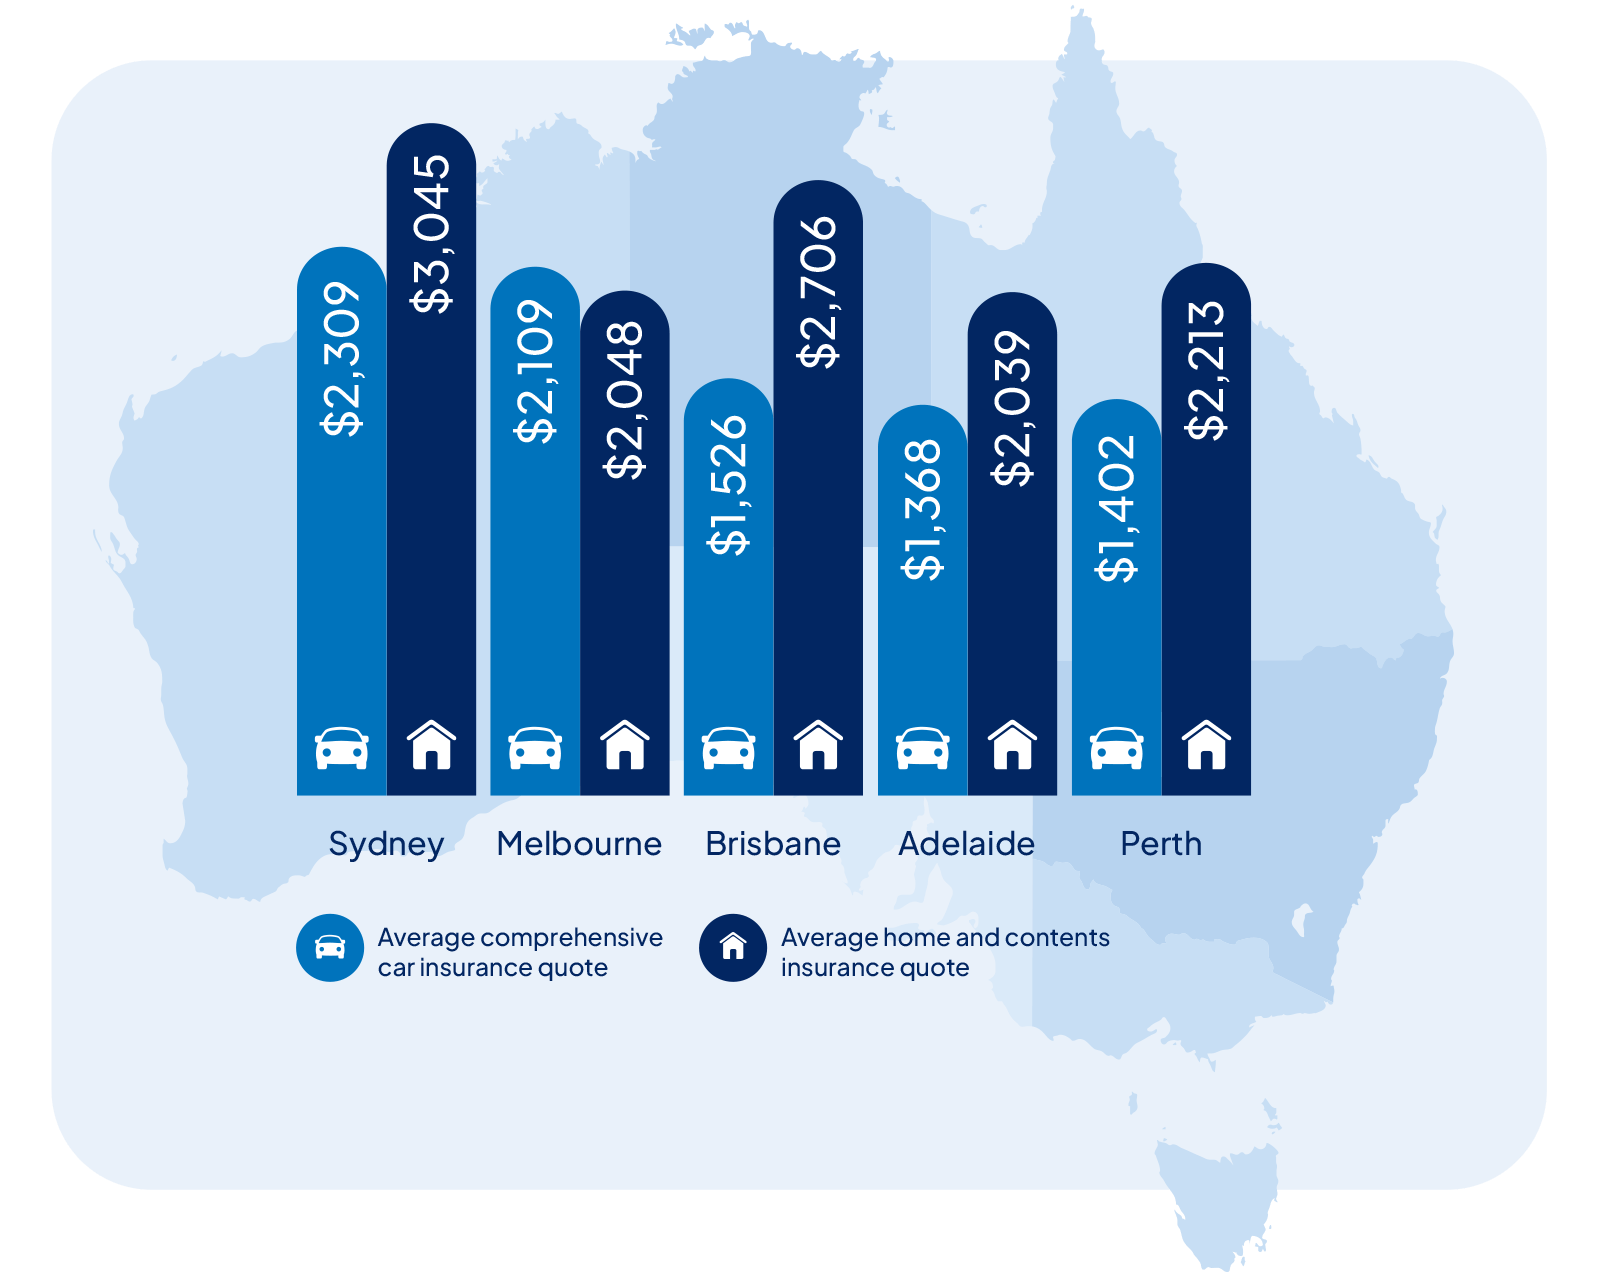
Car insurance quote index
Based on average indicative comprehensive car insurance quotes available from Compare the Market and also from selected popular industry brands. We used a target excess of $1000 or as close as possible where this was not available. Quotes for a white 4-door 2020 Toyota Corolla driven 12,000 km on average per year by a 30 year old male driver. See notes for further information relevant to the pricing of the policies. Quotes collected on 30/08/2024 – 01/09/2024. Your quotes will vary depending on your unique circumstances.
Home and contents insurance quote index
Based on average indicative home and contents insurance quotes available from Compare the Market and also from selected popular industry brands. Quotes for a typical low-set, 4 bedroom 2 bathroom, freestanding brick veneer home with tiled roof, insured for $700,000 with $80,000 in contents with a target excess of $1000 for both home and contents. Our home owner was a 30 year old male who lives alone with no previous claims. See notes for further information relevant to the pricing of the policies. Quotes collected on 30/08/2024 – 01/09/2024. Your quotes will vary depending on your unique circumstances.
How the cost of everyday necessities is pushing families to the brink.
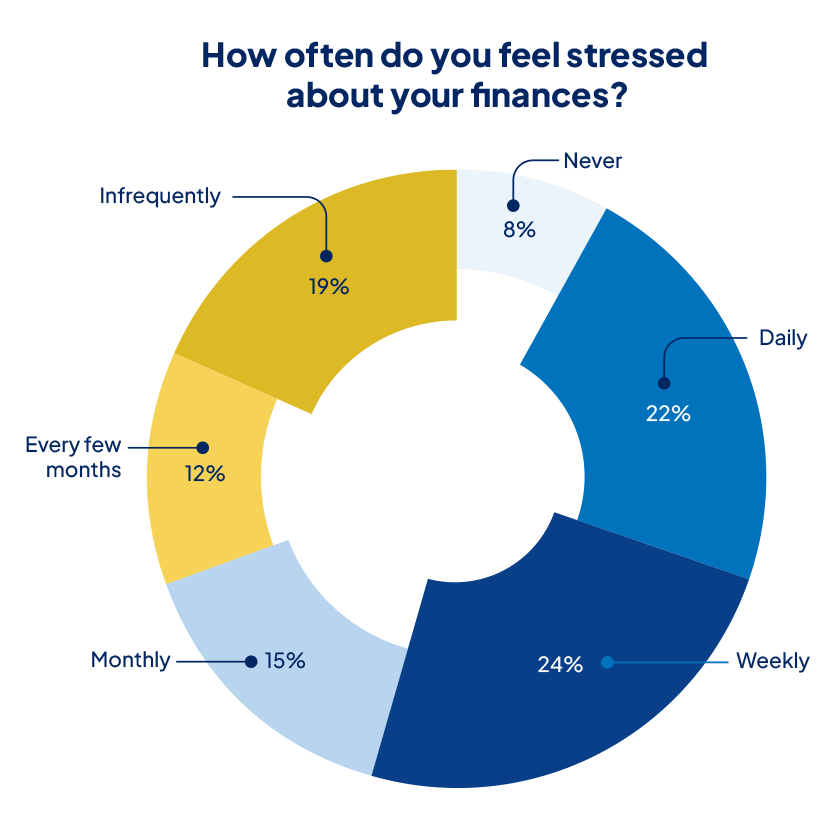
One in five Australians we surveyed (22%) feel stressed about money every day. Millennials carried the biggest emotional burden with 28% experiencing daily stress, almost three times more than people aged over 79 and close to double the rate of Baby Boomers.
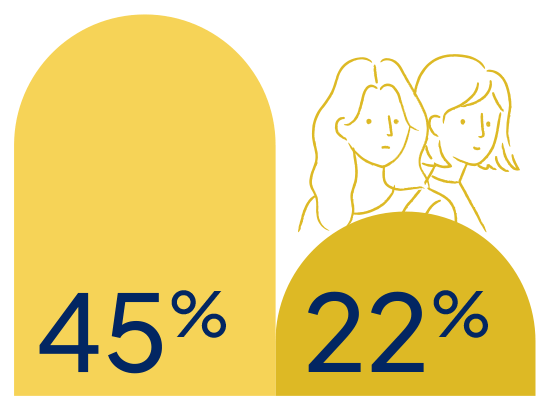
Double the number of stay-at-home parents feel stressed about their finances daily (45%), compared to full-time employees (22%).
Single parents with dependent children were much more likely to report regular financial stress than couples with children.
Rising costs across the board are continuing to impact Australians’ ability to save. Our survey participants told us:
29% of Australians haven’t been able to save as much as they usually do
Around one in five (18%) say their savings are going backwards
15% of respondents are now in debt or are seeing their existing debt grow
But it’s not all doom and gloom. Around one in five Australians (22%) say they’ve been able to save money consistently, with 6% even saving more than before.
While many renters have been hit with hikes over the past 12 months, homeowners were more likely to report their savings had reduced or halted over the past year.
We’ve seen the cash rate climb from a historic low, to its highest peak in over a decade. That means someone with a loan of $610,000 is now paying roughly $1,500 more in monthly repayments – or about $18,000 a year – and that’s eating away at homeowners’ savings.
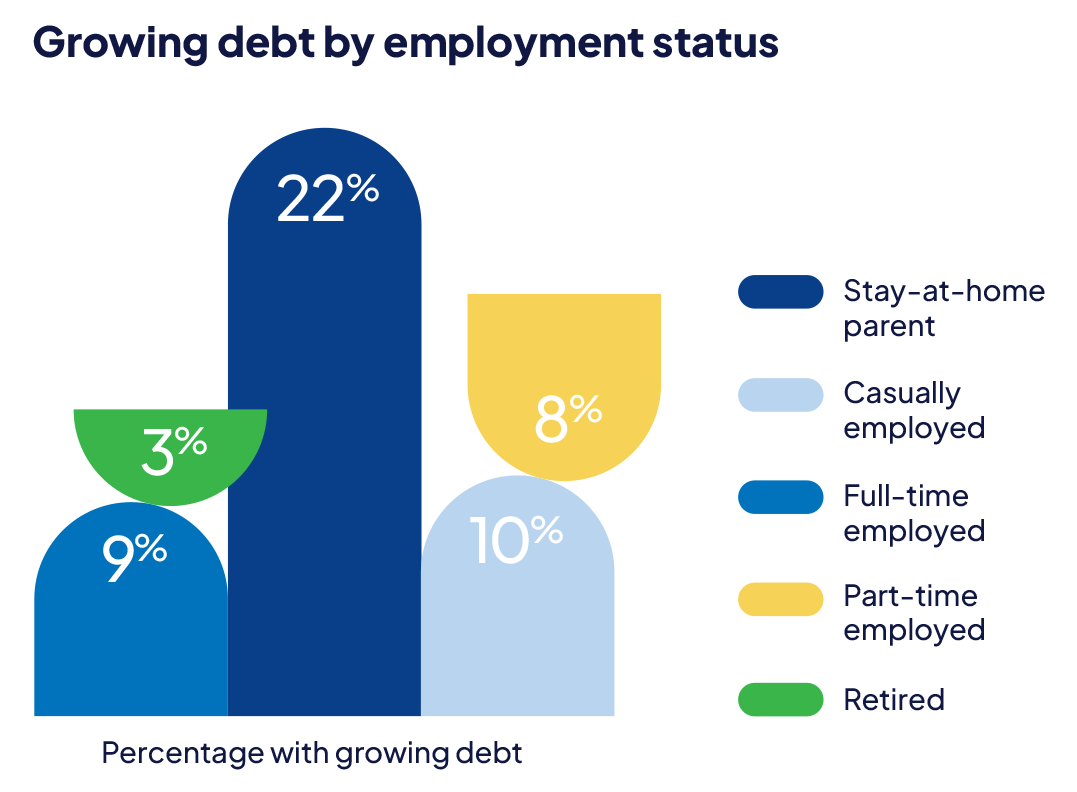
Stay-at-home parents have disproportionately seen their debt grow over the past 12 months, with a fifth of respondents seeing their debt balloon. In contrast, 3% of retirees added to their debt, while most people in full-time, part-time or casual employment had managed to keep their heads above water.

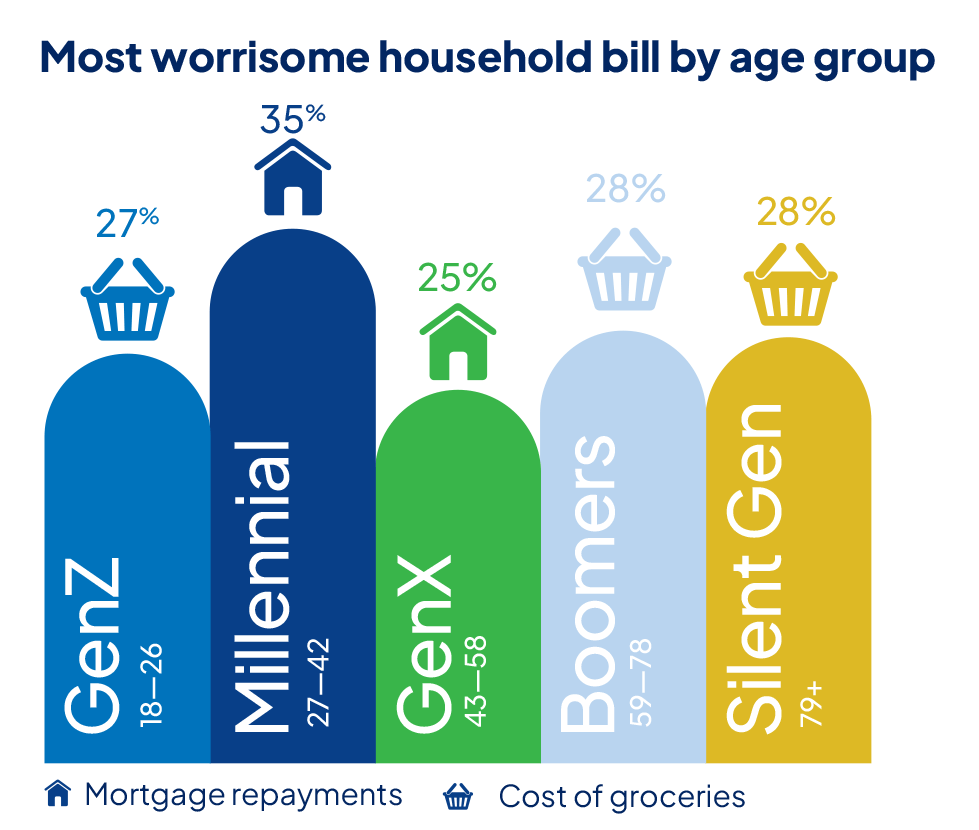
It’s the everyday expenses that Australians can’t really avoid like groceries, mortgage repayments, energy bills and rent that are causing the most stress. A quarter of Australians (25%) say the cost of groceries is their most worrisome bill, followed by mortgage repayments (20%), energy bills (14%) and rent (13%).
Baby Boomers felt the hardest hit by skyrocketing grocery prices, with 28% of the cohort listing it as their biggest household bill concern.
Full-time employed Australians listed mortgage repayments as their biggest financial worry. This trend was particularly evident in workers from the younger generations.
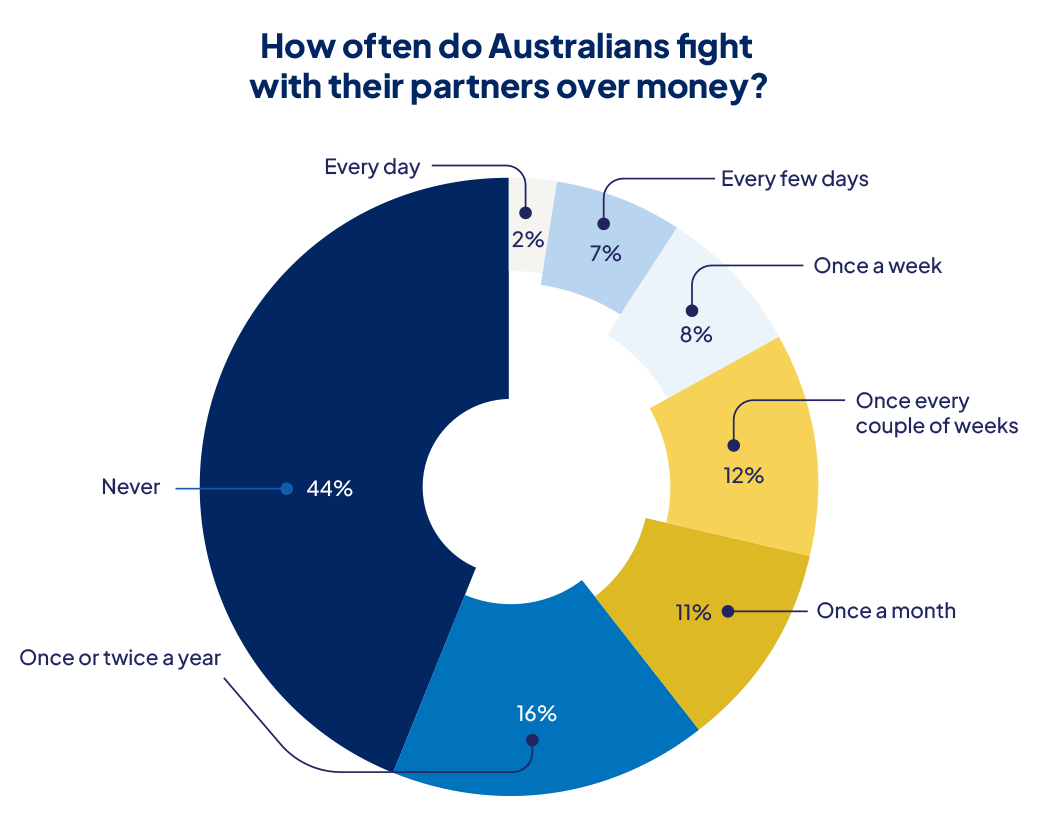
Over half (56%) of Australians that were either married or in a relationship said money trouble had caused arguments during the past 12 months.
Around 1 in 10 (12%) quarrelled every couple of weeks or at least once a month (11%). Concerningly, 7% say they’re disagreeing with a loved one over money every few days.
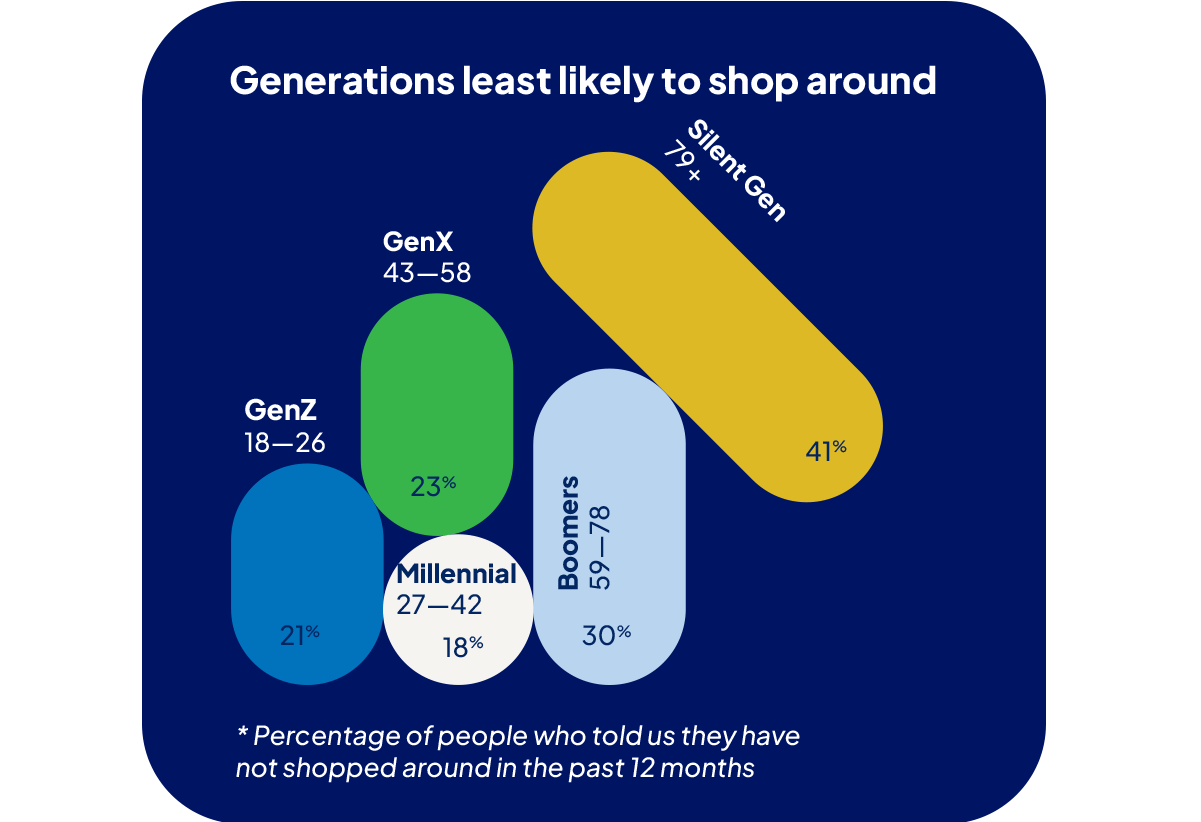
Shopping around for a different product or a new provider may help you get a better deal, yet a quarter of Australians surveyed (24%) haven’t tried to save on the most common bills in the last 12 months.
Older Australians were most likely to remain loyal to their favourite brands. Pensioners who use more of their income to pay for things like insurance actually stand to gain the most from making a switch.

Less than half (42%) of those surveyed who are homeowners have refinanced their home loan, with older generations the most likely to stay loyal to their current lender. Just 14% of Aussie homeowners over 79 said they ever refinanced.

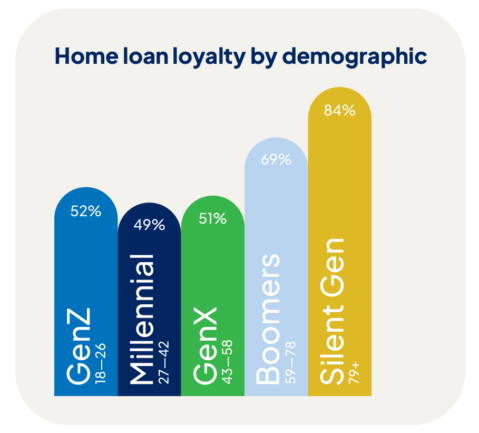
But what could this mean for the 58% who remain loyal? Essentially, they could be paying thousands of dollars more in interest over the life of their home loan.
The difference between front-book (what new customers pay) and back-book (what existing customers pay) rates can be substantial. While a percentage or two difference may not seem significant, it could equate to hundreds of dollars of savings a month and thousands over the life of a loan.
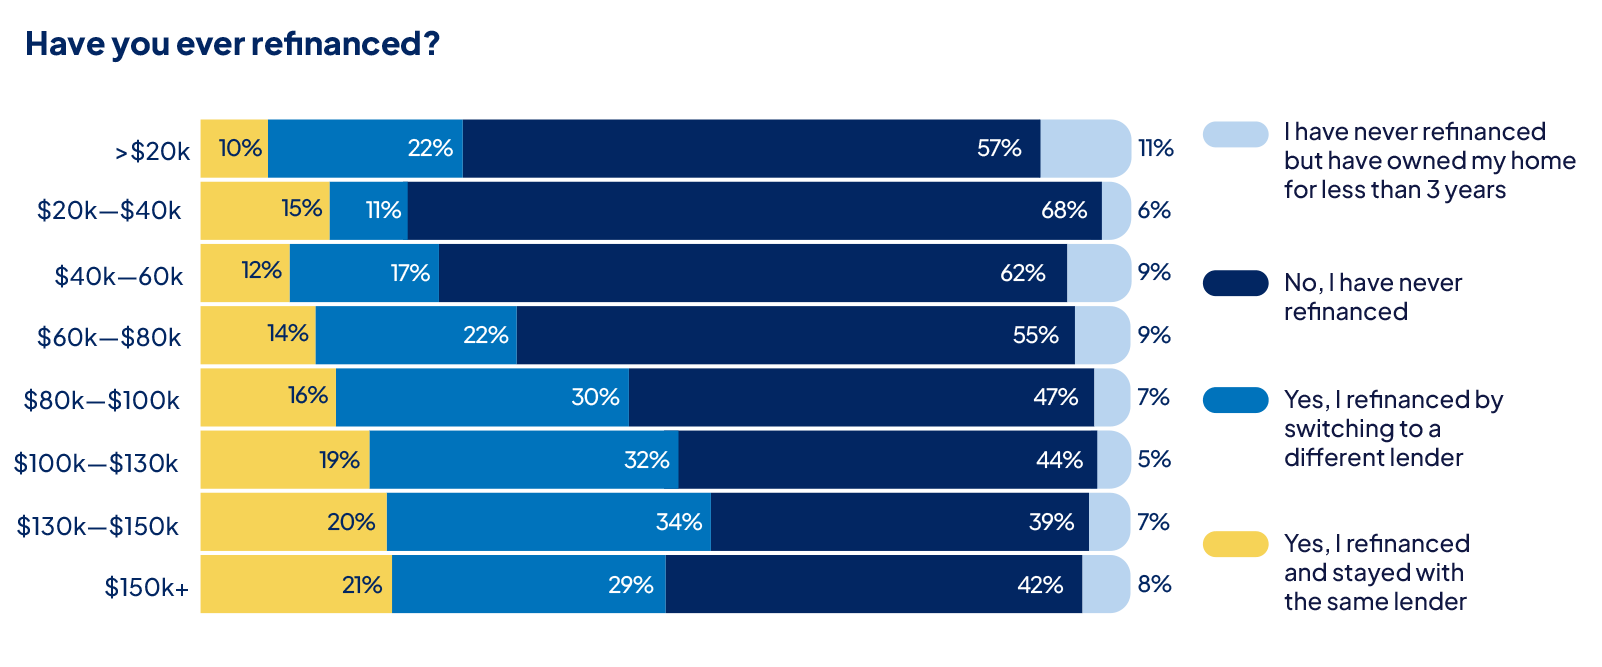
Interestingly, it’s higher income earners with wages over $100,000 a year, who tend to be more open to the idea of refinancing. Our survey results showed that people earning between $130,000 and $149,999 were more likely to have refinanced than those in other groups.
Around half of Gen Z and Millennial homeowners said they required support from the Bank of Mum and Dad to purchase their property.
Around 20% of Gen Z said their parents helped them by going guarantor on their home loans, and a further 22% said they lived with their family rent-free to save for a deposit.
The data also showed two-in-ten Millennials were gifted money to buy property. The median amount homeowners were gifted or given as an interest-free loan was $40,000.
Older generations were much more likely to have purchased property independently. More than 90% of those aged 58 or above didn’t require any support to buy property.
“Before the year 2000, you could buy a home for less than $70,000 – now that’s the deposit,” Mr Clancy said.
“While home buyers in the 90s faced punishingly high interest rates of 17%, house prices were much lower.
“Borrowers didn’t have to save for huge deposits; they could borrow less and spend less on housing. The key difference between the 90s and now is that average mortgage size has risen six times faster than wages.”
Compare the Market Chief Executive

| Year | Cash rate | Average loan size | Median weekly income | Weekly mortgage repayments | % of income on mortgage |
| 1990 (Feb) | 17.00% | $67,700* | $460 | $223 | 48.48% |
| 2023 | 4.35% | $593,000 | $1,250 | $681 | 54.48% |
| 2024 | 4.35% | $637,000 | $1,300* | $731 | 56.23% |
The average loan size in Australia was $67,700 in the 1990s. Now it’s $641,000. Despite this, homeownership remains a top priority for young Australian adults.
An overwhelming 65% of aspiring homebuyers said they could only afford to buy a property with help from the Bank of Mum and Dad. A further 25% said they would require financial support, though their parents could not provide it.
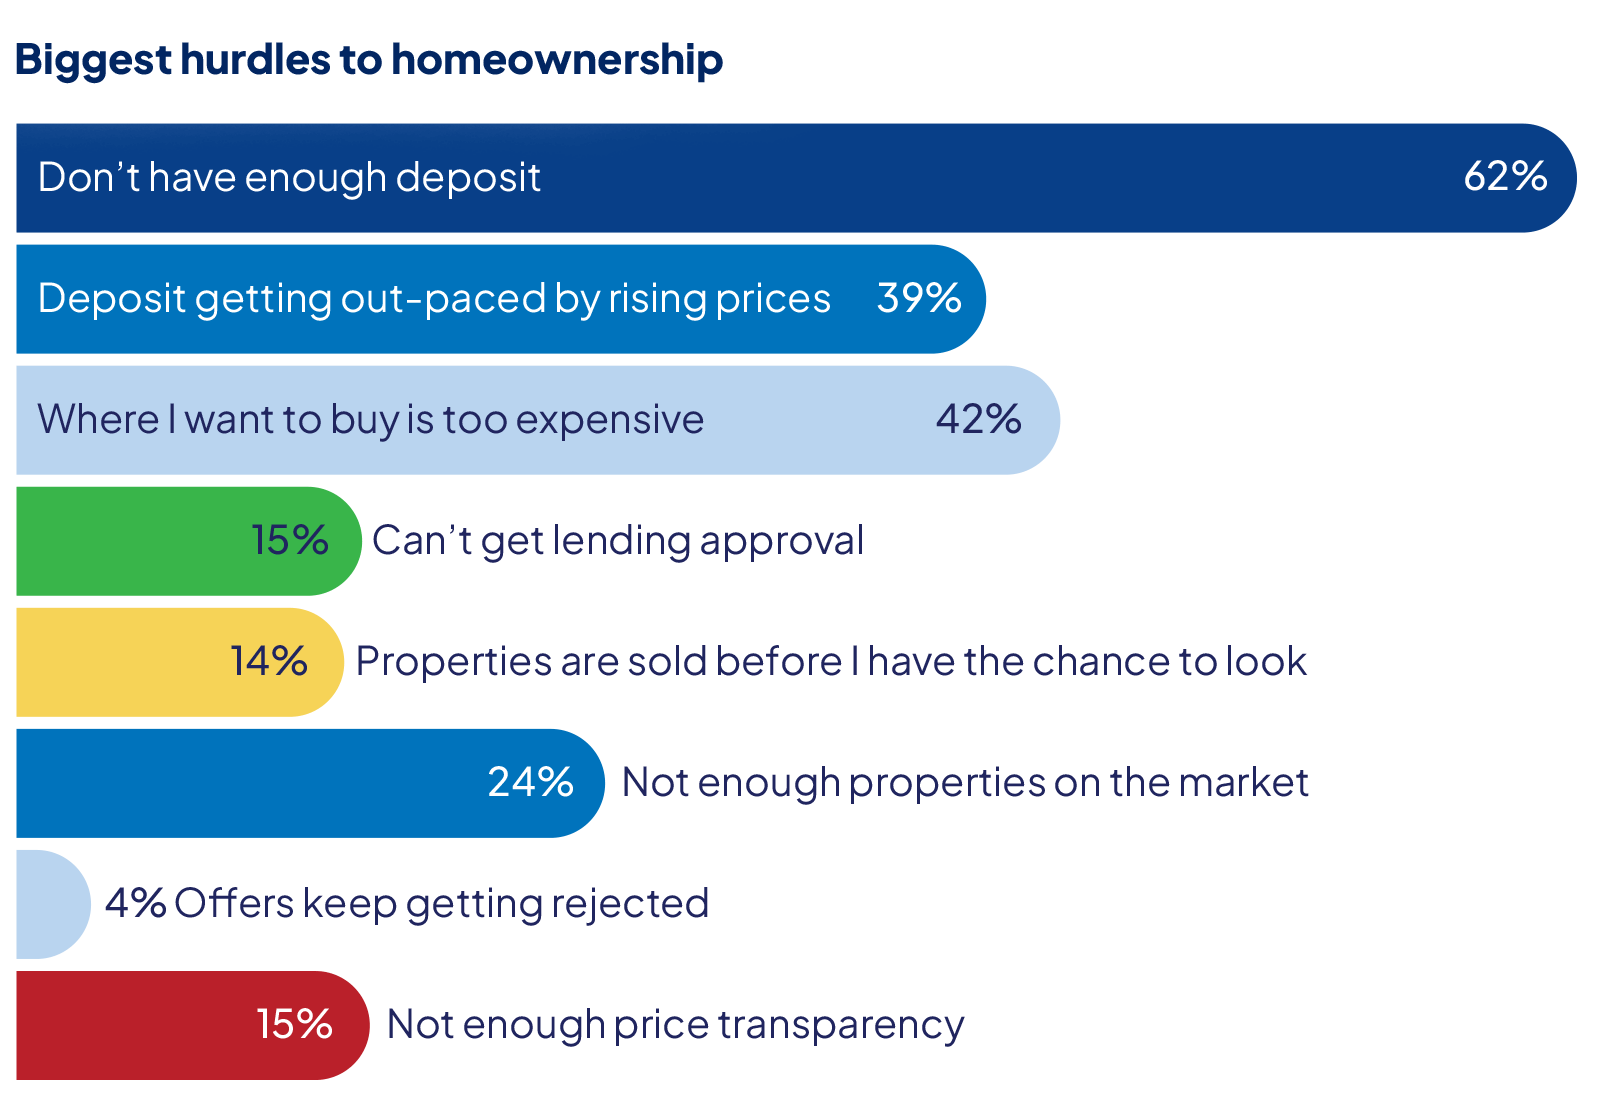
The most common hurdle for house hunters was not having enough of a deposit (62%). The average respondents had saved was $28,411 – that’s roughly 3% of the average dwelling price, which was $959,300* in June 2024, well short of a 20% deposit.
Seeing no other way to achieve their homeownership dreams, half of those surveyed (54%) are sacrificing their social life, cancelling or delaying holidays (30%) or taking on a side hustle (20%).
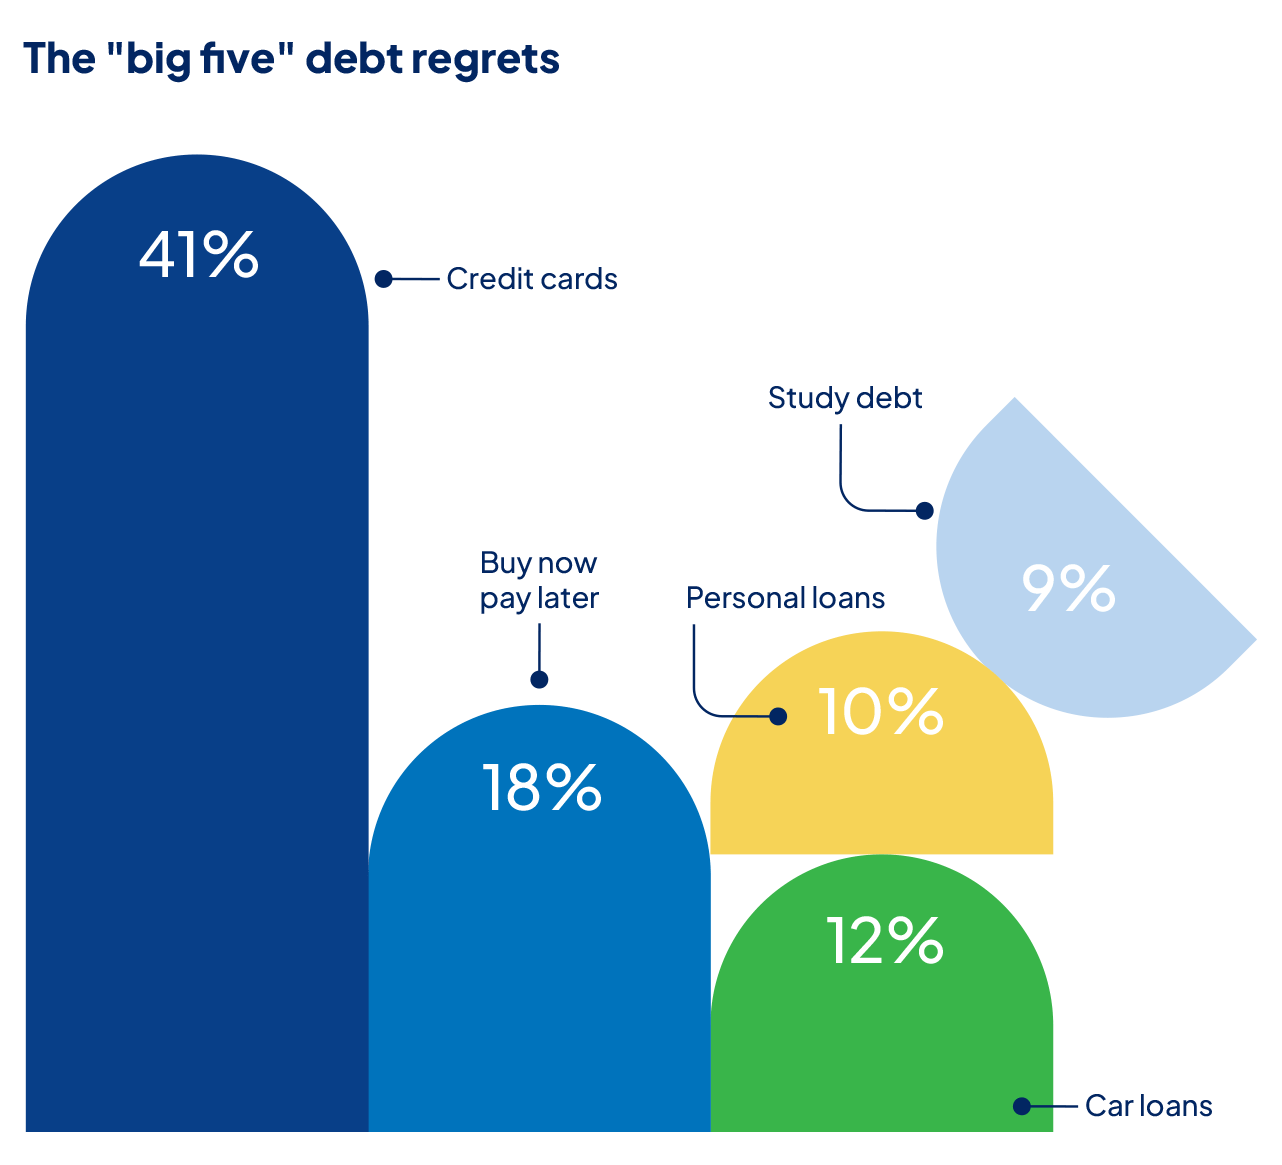
Around one in ten Australians reported having a car loan or personal loan. Just under 9% of people said they owed their family money.
But we know people are working hard to reduce outstanding balances. Between 2017 and 2022 Australia’s total credit card debt dropped from $31.2 billion to $19 billion, according to the Australian Securities and Investments Commission.*
Compare the Market Economic Director David Koch said people were working hard to pay off loans, which had become a coping mechanism for people during the cost of living crisis.
“Unfortunately, many people have been forced to take on debt to afford necessities like electricity, petrol, and groceries,” Mr Koch said.
“A lack of awareness around interest accrual and late payment fees could mean that even small purchases end up costing people much more than they need to.”
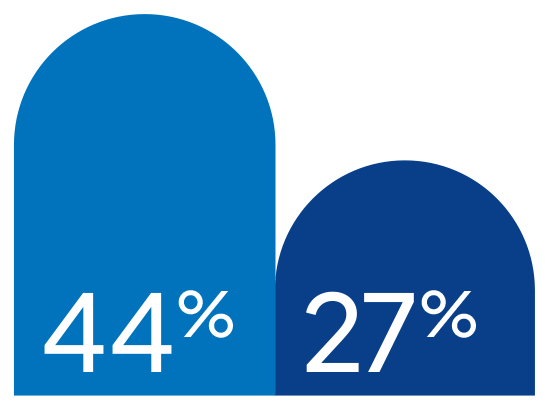
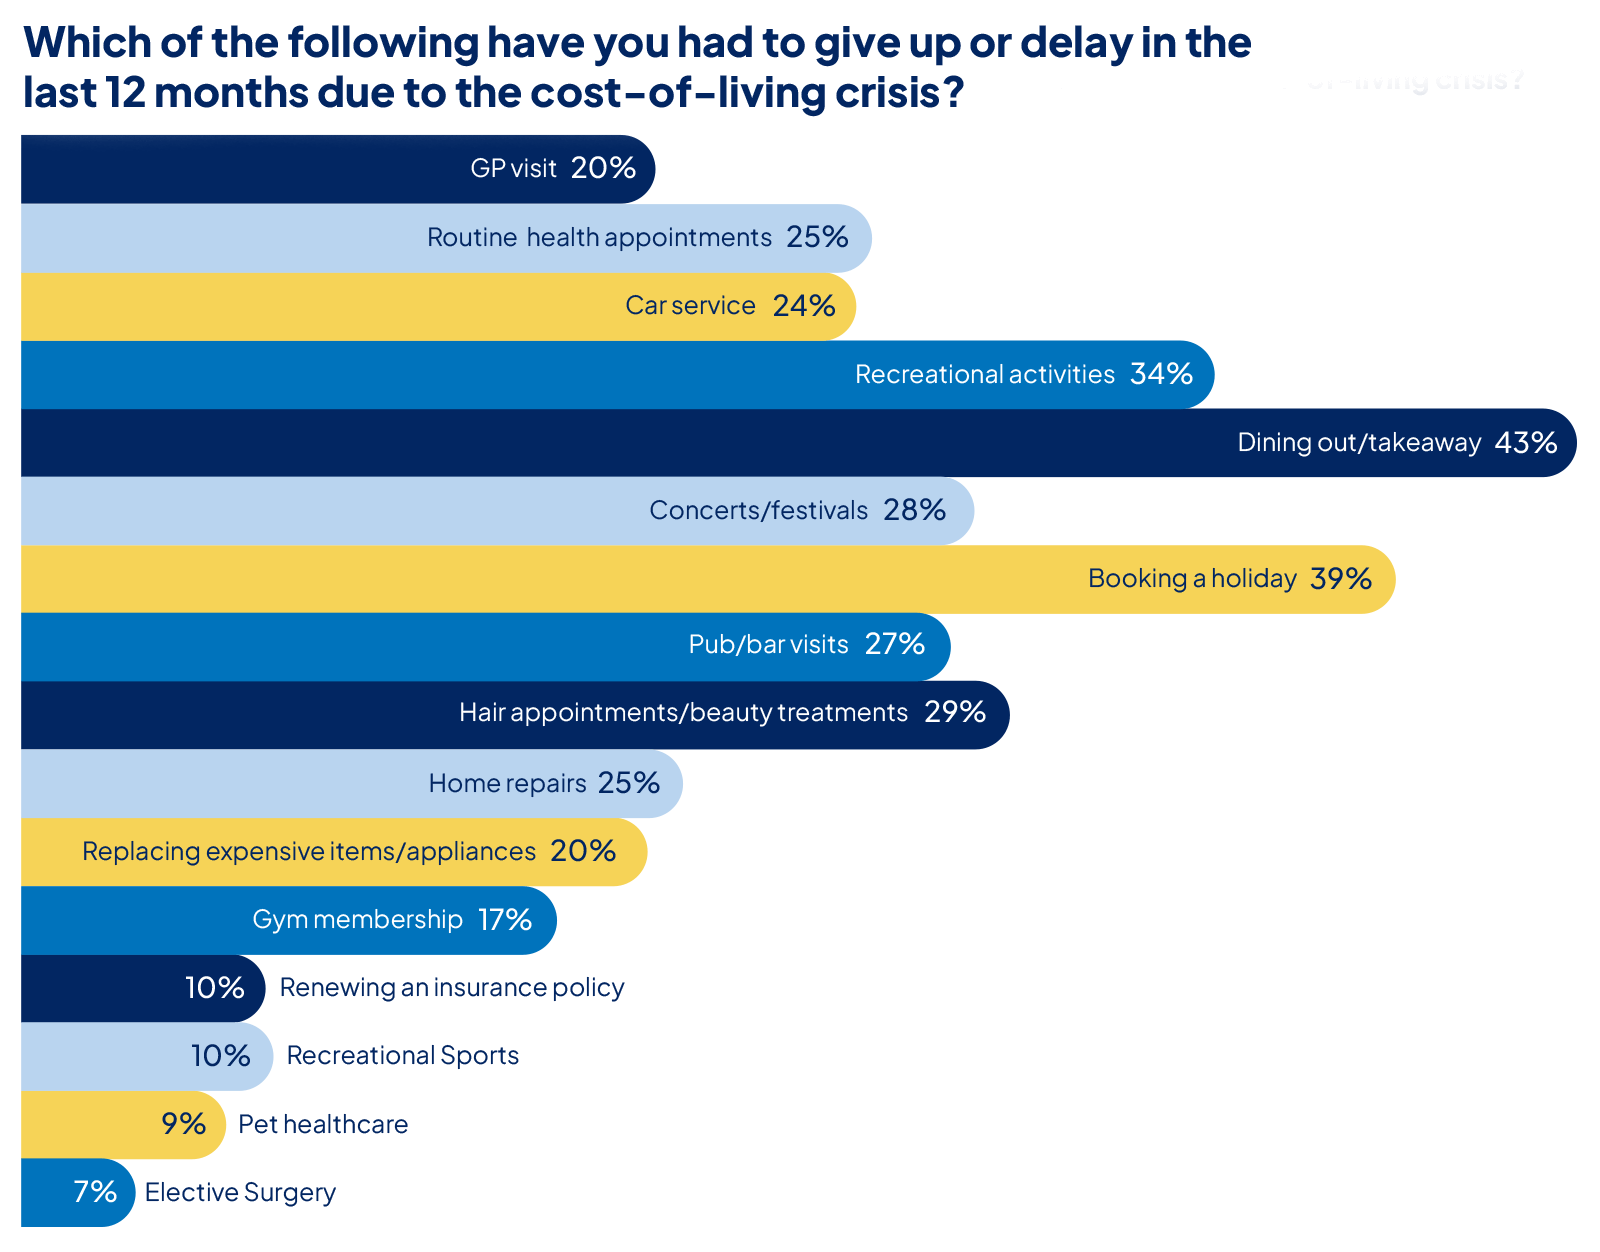
Three-quarters of Australians surveyed had changed their spending habits due to the cost-of-living crisis in the last 12 months, with 43% saying they’ve given up dining out/takeaway while 39% were delaying holiday plans.*
Concerningly, necessities such as health care have also been neglected. Approximately one in five people had avoided a GP visit to save money on out-of-pocket expenses.
Takeaways, holidays, hair appointments and pub visits take a hit as Aussies face the cost-of-lifestyle crisis.
Finances are always challenging but I can’t think of a time when they weren’t…challenges will always exist.
Everything has gone up except the paycheck so I have to budget and live from paycheck to paycheck.
I need a second income just to maintain my current bills. Very little left over.
You can’t save…no matter what you do…everything has been cut back.
Rising costs has seen me quit my full time job to go casual so I can earn more money. I have found myself paying everyday expenses like car rego, bills etc on a Buy Now Pay Later service…I’m now trying to manage my finances better.
I have been more financially stressed than ever before. I have considered concluding my tertiary education degree early in order to work full time to support myself…making ends meet is always on my mind, and I feel as though luxuries like travel and saving to put a deposit on a house is unattainable.
I am saving on utilities by not using them, decline to go to some medical appointments, using the car less, having a go at growing some of my own food. I buy second hand clothes or don’t buy at all.
Rising costs have made it harder to save money for a deposit as well as rising house costs making it unattainable.
I struggle to make it on my wages. I end up not being able to buy all the groceries I need and putting bills into payment plans.
It makes it very difficult to travel to see friends and family. It has completely changed my views of enjoyment in retirement.
All money is going on living expenses. My savings for house deposit have now gone and I’m back to where I was five years ago.
We’re more stressed…about how we can afford to move out and purchase a home in the next few years with rising house prices and rental prices also increasing.
I’m forced to live a lifestyle of near poverty and the worst thing is there is no end in sight to the rising cost of living. I am constantly struggling to meet bill payments, rent, food, electricity…
It has hurt as I am one person trying to keep up with rising costs, living moderately within my means and cutting down…to have something for children as I am widowed.
Started looking at everything I spend money on and comparing prices online much more than I had in previous years.
All my money goes towards my mortgage and bills and it is very hard to save money to put towards home improvements etc.
Have cut back on everything, feel hopeless, money and finances are a constant headache and it all feels like it’s for nothing.
It has been an emotional stress, constantly thinking about finances. Not being able to afford what I once enjoyed.
Research undertaken in 20171 estimated that $3.5 trillion is set to be passed down by Baby Boomers over the next two decades, with 55% of Australians aged 79+ expecting to pass down at least one property.
About 15% of Australians surveyed had intentions to pass down a cash inheritance. People aged 79+ planned to pass on a median $500,000 lump sum for their loved ones.
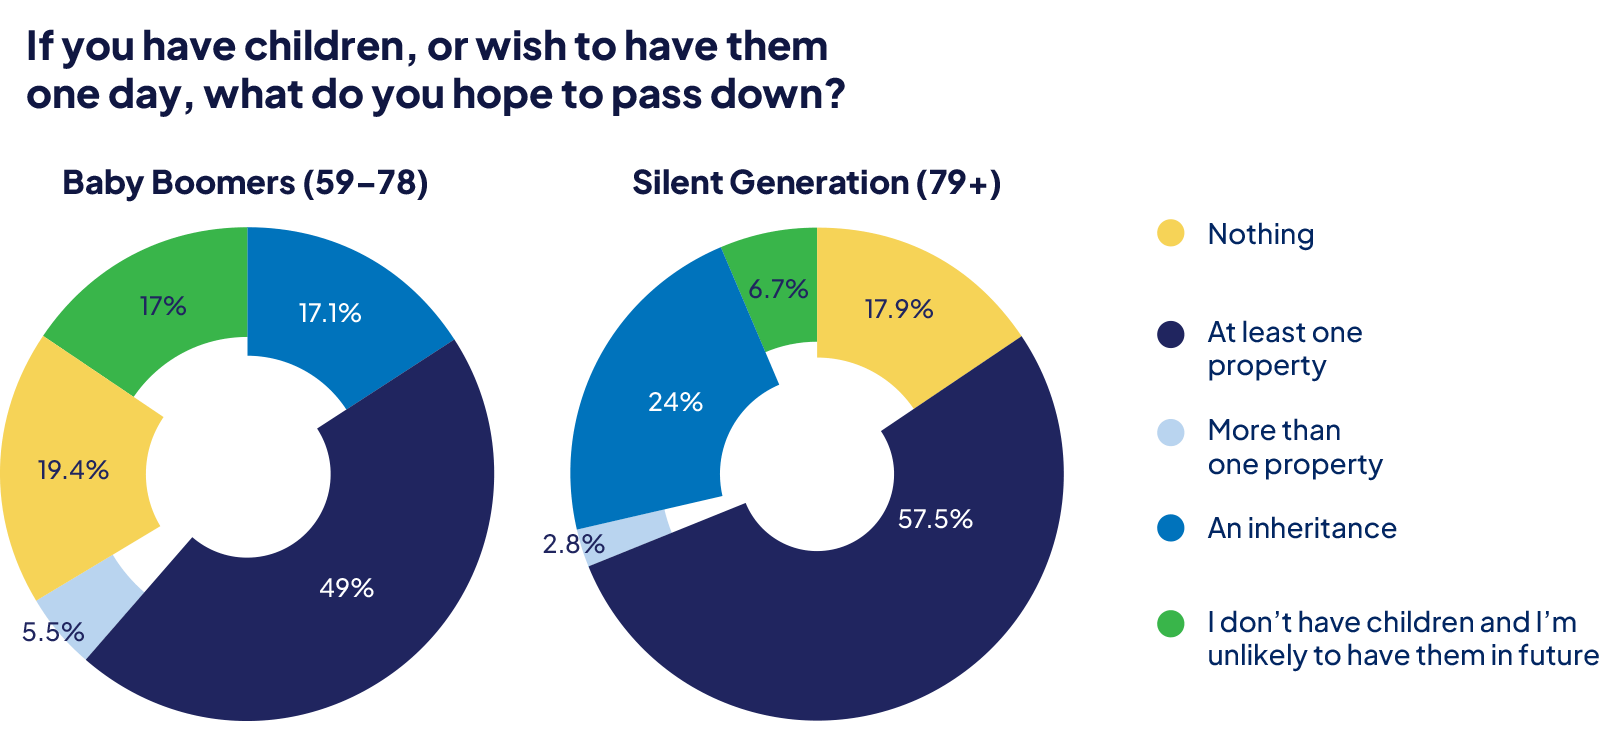
With Australia’s median dwelling2 value sitting just above $800,000 and rising at a rate of approximately 6% in the last year, this represents a significant gap between those passing down a cash inheritance and those bequeathing property.
Unsurprisingly, those who have already broken into the property market are more likely to hand down at least one property to their children as a generational asset, at a rate of 56%. Meanwhile, Australians who had multiple investment properties had the highest hopes of passing down multiple properties, at 32%, a massive jump from the average 10%.
Coincidentally, the current median dwelling value is almost precisely the median amount Australians believed necessary in order to retire comfortably, at $800,000.
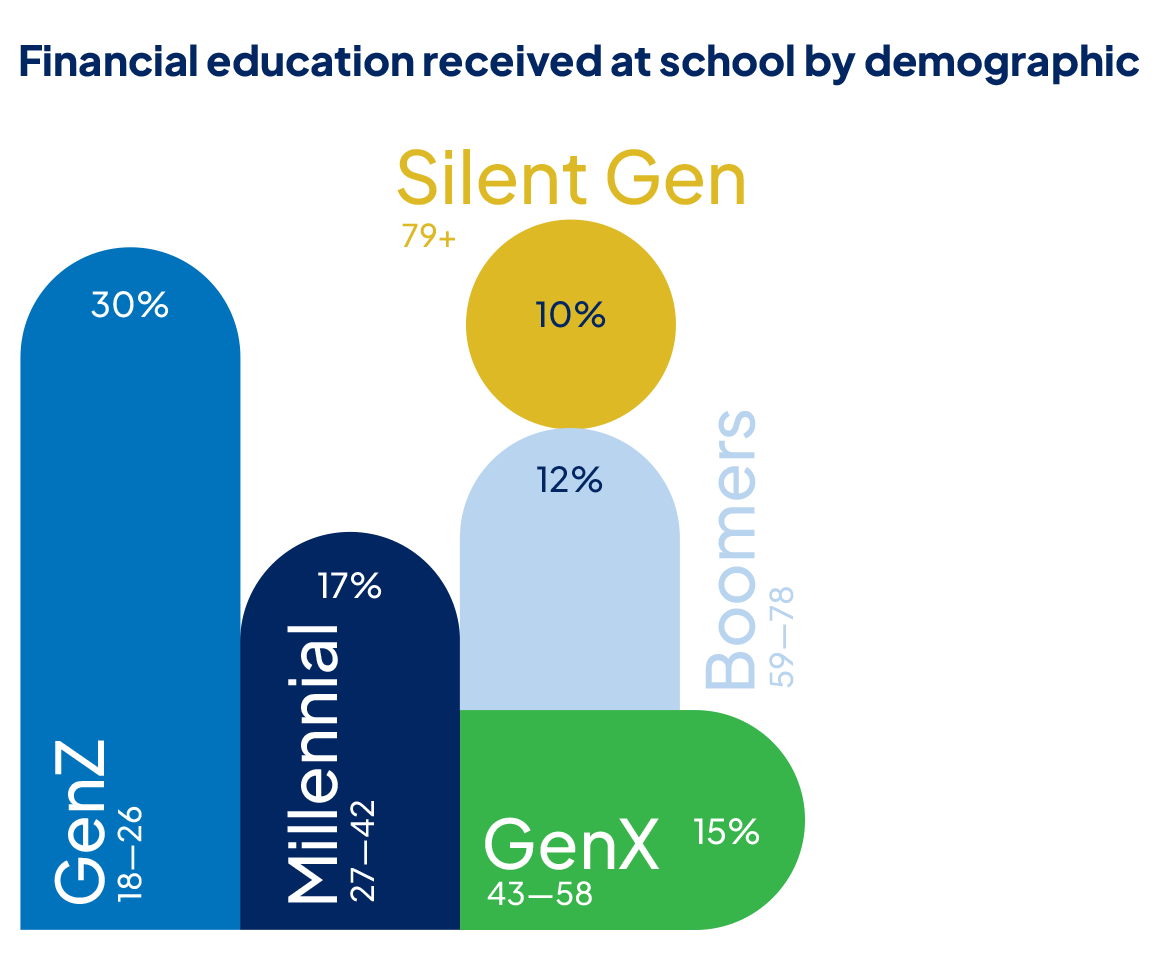
81% of Australians surveyed reported not receiving any financial education in school. While younger Australians were more likely to have covered financial topics at school, two-thirds of Gen Z respondents still said they hadn’t received any financial education during their schooling years.
Some states are leading the financial education charge, with the Australian Capital Territory and Northern Territory both breaking ahead at a rate of around 28%. Conversely, Tasmania has lagged behind at 9%.
Perhaps heightened by the current state of finances, 95% of Australians believe financial education should be added to the school curriculum.
A slight trend emerged across Australians’ salaries and their thoughts on financial education, with those earning $150,000 or greater being the largest percentage of Australians wanting financial education added to the curriculum, at 97%.

The quintessential Aussie schooling experience features a bit of algebra, the Pythagoras theorem, some Romeo and Juliet, and – inexplicably – how to play Hot Cross Buns on the recorder.
But ‘one a penny, two a penny’ won’t get you very far when it comes to managing the household budget and that’s exactly where our education system could be letting us down.
Aussie kids aren’t learning anywhere near enough about personal finances, with Compare the Market research revealing most Aussies received little to no money education at school.
In today’s difficult economic climate, knowing some budgeting basics could be the difference between saving for life’s small pleasures and sliding headfirst into debt.
And for a long time, we’ve been told that it’s a parent’s responsibility to teach their children about finances. But times have changed.
While parents still play a key role in transferring financial attitudes, behaviours and knowledge to their children, many people feel the curriculum could be improved.
Now it’s rare for one parent to work while the other stays at home to raise their kids. The rising cost of living has made it nearly impossible to survive on one income.
This means working parents only have weeknights, weekends, and holidays to teach their kids about money.
About 95% of Australians believe children should receive greater education about managing personal finances and budgeting during school, according to our Household Budget Barometer.
That’s why I’m delighted that Compare the Market is calling to make financial literacy a compulsory unit in the school curriculum.
Students need to be taught ways to manage their personal finances, how to budget, the pitfalls of credit and the importance of saving money.
These are all essential life skills that many of us have had to learn on the go and unfortunately, some people have suffered financially because of their lack of financial knowledge.
Compare the Market Economic Director


When someone says, “think of a home” what comes to mind? A Federation bungalow brimming with charm? A weatherboard home with a white picket fence on a quarter acre block? A cosy, two-bed apartment in an area chock-a-block full of amenities?
As Australia grows, the way we picture property is changing – and size isn’t all that matters. We need more units and townhouses in places that are convenient and close to our cities.
The shortage of housing stock is a significant issue across Australia, particularly in our major cities, which are experiencing record population growth.
Finding a place to live—whether renting or buying—has become increasingly unaffordable and challenging.
Now the ‘Not In My Backyard’ (NIMBY) movement has been outvoiced by a wave of aspiring buyers chanting ‘yes’.
While sceptics might face some initial adjustments, medium density housing undeniably offers a viable solution to the nation’s housing crisis.
The Australian government plans to build 1.2 million new homes within five years to address the housing crisis. However, a skills shortage, inflation and declining council approvals could make us fall short of this target.
Recent data from the Australian Bureau of Statistics (ABS) showed a 0.3% drop in approvals in April, down to a seasonally adjusted figure of 13,078.
While some councils could streamline processes for builders and developers, this isn’t the root cause of the housing crisis.
To meet the demand for more medium-density housing, state and local governments must collaborate better and revise planning rules that restrict medium-density development in Australia’s capital cities.
They also need to engage with communities about potential changes and communicate the benefits of diverse housing options.
Moreover, governments must invest in infrastructure to support growing populations, including parks, schools, and public transport. Ensuring that a portion of medium and high-density housing is affordable and built to high standards is crucial for buyers and renters alike.
We also need a better mix of commercial spaces, for cafes, retailers and gyms to usher in gentrification.
So the next time you see a development application in your area, resist the urge to panic!
The new unit block down the road could be a fantastic steppingstone for the next generation.
Compare the Market Property Expert


It’s one of life’s biggest and most rewarding investments. Their happiness yields dividends.
It’s why I was so pained to see that cost of living pressure has robbed so many parents of these joys over the last 12 months.
We’ve heard from parents who were forced to cut back on childcare because they could no longer afford the fees, only to return to work and ask others for help.
Other stories included parents giving up entertainment, kids sport as well as family holidays. While these activities may be considered “discretionary” or just “nice to have”, I think they are just as important.
Our hobbies and interests enrich us. So when footy gets put on ice, it cuts us to the bone.
When two overworked parents can’t afford a short vacation, it can be soul crushing.
Stay-at-home parents are among the hardest hit. Our Household Budget Barometer revealed a disproportionate number of full-time parents – 45% – stressed about their finances daily compared with 22% of the general cohort.
Some respondents said they had given up their caring duties to return to work. With the median house price now just over $800,000, for most households one salary won’t cut it.
Meanwhile, elderly parents are supporting their adult children for longer.
The financial burden was laid bare for house hunters too, with two-thirds (62%) saying they would likely require some financial support from their parents to buy a home, while 26% feared their parents just wouldn’t be able to step in.
About 9% of aspiring young homeowners said they had moved back in with their parents to save for a deposit. A further 11% said they had delayed having children of their own while they worked towards financial goals.
Being a parent in Australia means so much more in 2024. It means having the grit to work long hours for a salary that doesn’t stretch as far as it used to, just to cover the increased cost of groceries, fuel and energy.
Parents are doing their best to make it work, and I applaud each and everyone of you. Our children are the future, and they need us now more than ever to get there.
Compare the Market Chief Executive
When every dollar counts, it pays to compare. For over a decade, Compare the Market has strived to empower Australians to take control of their household budgets and maximise their savings.
Since 2012, our free-to-use smart technology has assisted 23 million comparisons and counting, for Australians searching for savings. By aggregating offers from our providers, we simplify the process of comparison across Car Insurance, Home and Contents Insurance, Health Insurance, Home Loans, Electricity and Gas, Travel Insurance, Pet Insurance, Life Insurance, and Income Protection.
Why simply accept a price increase on your insurance, energy plan, or everyday expenses? You have the power to compare.
Compare the Market’s 2024 Household Budget Barometer was based on a survey of 3,000 Australians in August 2024. The survey sample is nationally representative in age, gender, location and income.
Car insurance quote index
Average indicative quote prices were based on comprehensive car insurance quotes available through Compare the Market and also from three popular industry brands not available through Compare the Market. Quotes for a white 4-door 2020 Toyota Corolla sedan (no modifications) driven by a hypothetical 30 year-old male who is employed full time, obtained their licence at age 17 and has no previous claims. The car is used primarily for private or commuting purposes and is driven 12,000kms per year and was parked overnight using the following suburbs which were selected as approximately 15km north, south, east and west of the nearby city centre:
Only policies with an excess of $1000, or as close to this figure as was possible with the relevant insurers, were used to calculate averages for these different locations. Quotes collected on 30/08/2024 – 01/09/2024. Your quotes will vary depending on your unique circumstances.
Home and contents insurance quote index
Average indicative quote prices were based on home and contents insurance quotes available through Compare the Market and also from three popular industry brands not available through Compare the Market. Quotes for a typical low-set, 4 bedroom 2 bathroom, 2 undercover carparks, freestanding brick veneer home with tiled roof, insured for $700,000 with $80,000 in contents with a target excess of $1000 for both home and contents. Where these sum insured values or target excess were not available we used the closest possible option with the relevant insurer. Our hypothetical home owner was a 30 year old male who lives alone with no previous claims. The following suburbs which were selected as approximately 15km north, south, east and west of the nearby city centre:
Only policies with an excess of $1000, or as close to this figure as was possible with the relevant insurers, were used to calculate averages for these different locations. Quotes collected on 30/08/2024 – 01/09/2024. Your quotes will vary depending on your unique circumstances.
Our standardised hypothetical house parameters were applied to each address, regardless of the actual property at that location. This allowed for an accurate comparison across multiple locations.
It is important to keep in mind that these prices reflect a diverse range of prices with a difference of hundreds of dollars between the cheapest and most expensive policy. These averages could be markedly different to how much it costs to insure your own car or home and contents, and you should exercise caution in applying these averages to your car or home before purchasing an insurance policy.
This insurance index is designed to provide an overview of insurance prices across various Australian cities and insurers. Please be aware of the following:
Editorial team: Chris Ford, Conor McNeish, Gabriela Cook, Hannah Norton, Kevin Goh, Lachlan Moore, Natasha Innes, Phillip Portman, Sarah Orr.