The Burrow


Trying to find your ideal home is a very personal journey, and there are many factors that may affect your decision. One of the most impactful elements to any home is, as real estate agents often say, “location, location, location.”
As home loan experts, we wanted to find out what location people prefer: a home in a central, city location; or a home in the suburbs.
To this end, we asked more than 3,000 Australians, Canadians and Americans to help us determine if the “suburban dream” is still alive for most people.
Come along with us as we dive into the data!

First, we asked people to choose if they would rather live in a house in suburbia, or a central / city location. Here is what the data looks like when we break it down by generation:
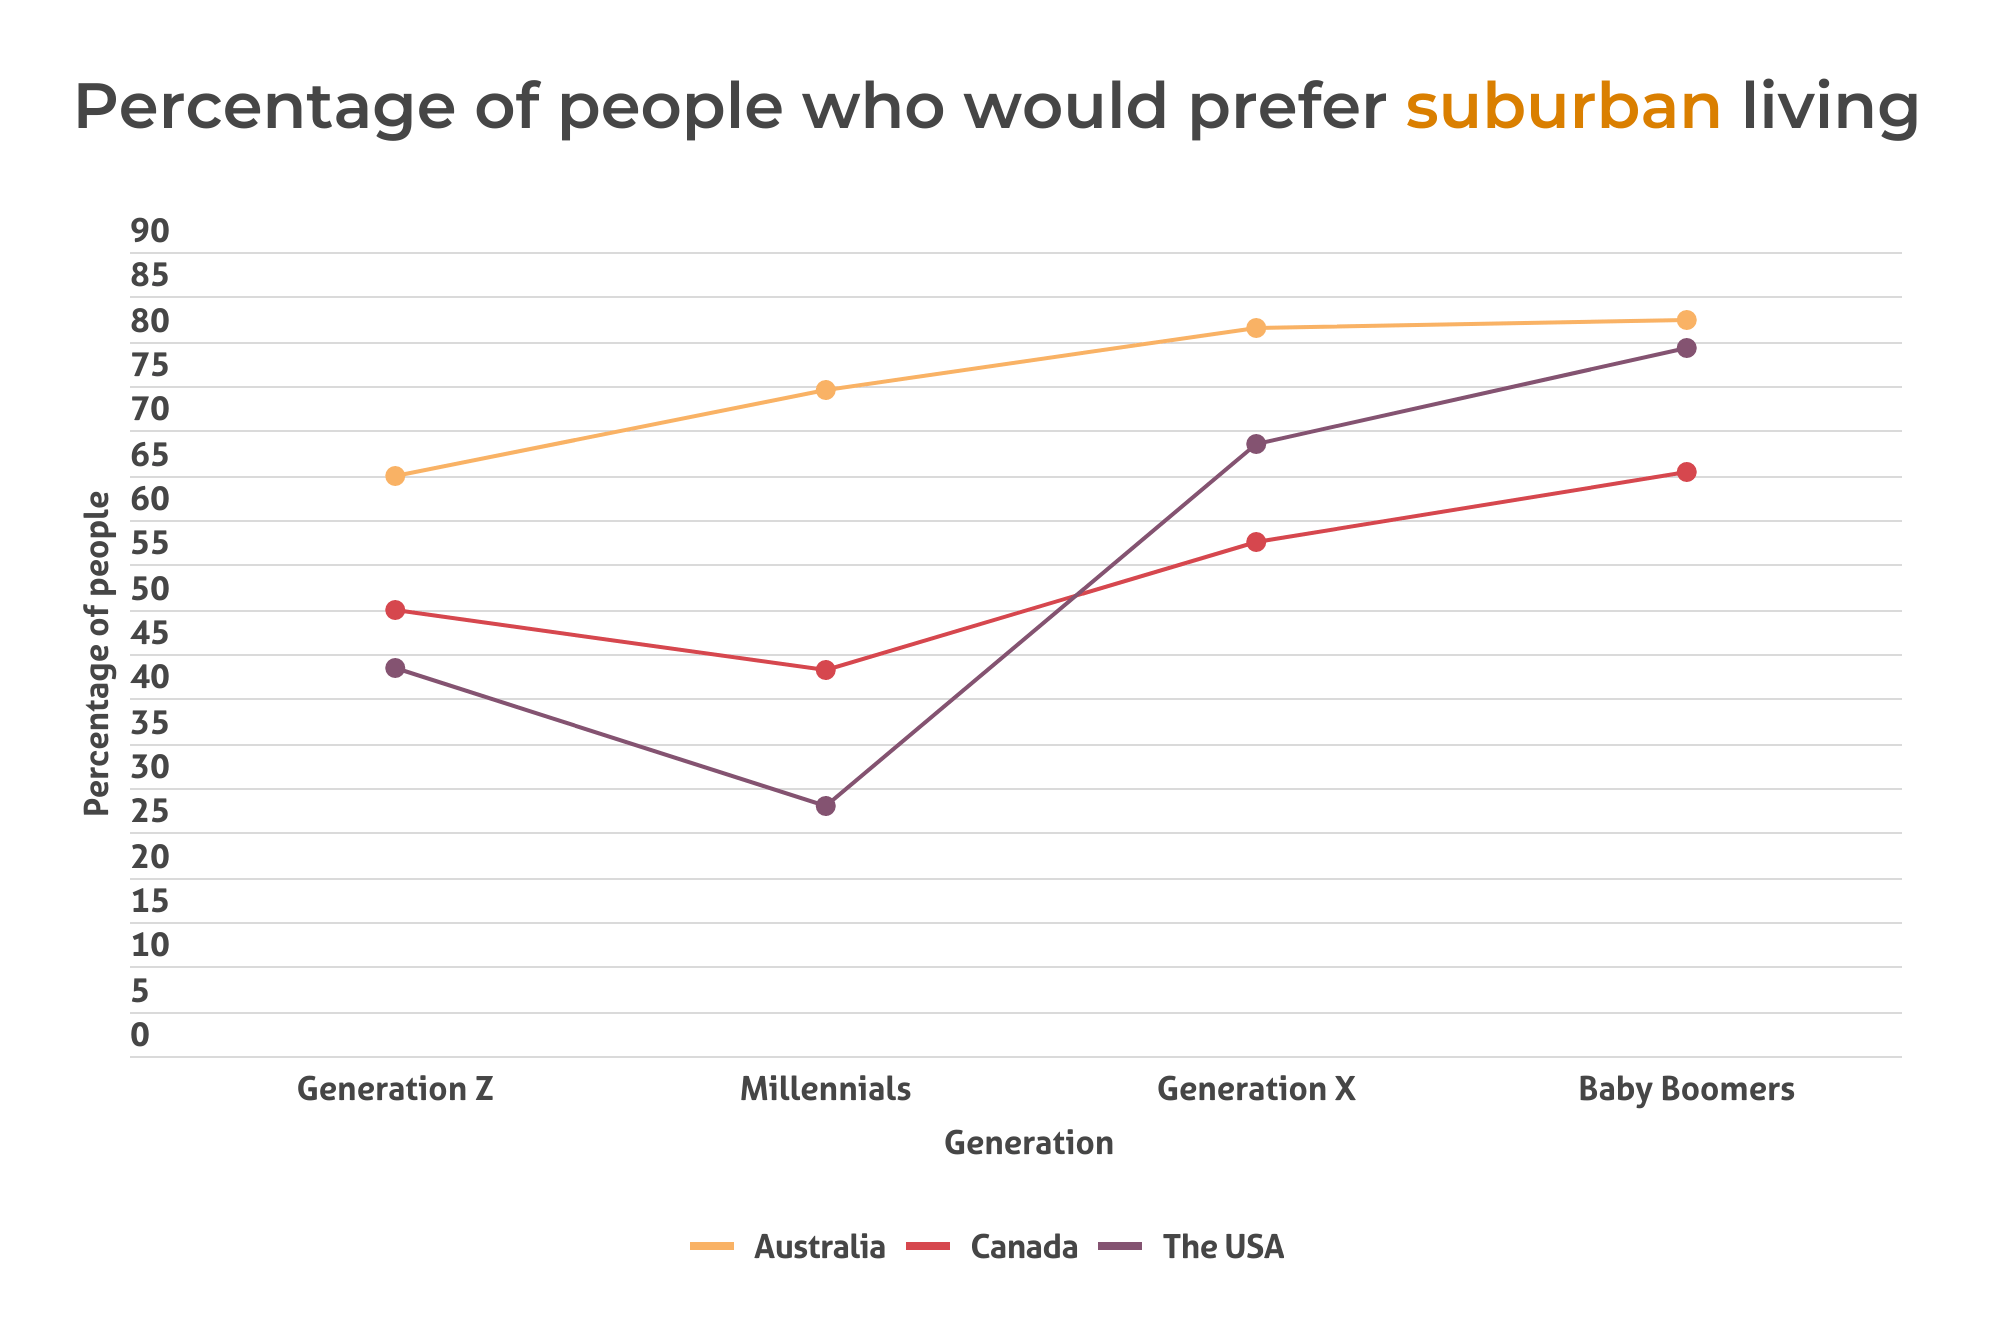
As we can see, Australians greatly favour suburbia over city living, and to a greater extent than either Canadians or Americans.
It seems that older generations tend to favour the suburbs more so than younger generations. In fact, while only 65% of Aussie Gen Z-ers said they would prefer suburbia, 82.4% of Boomers said the same.
Interestingly, in Canada and the USA this trend is similar, however in both cases support for the suburbs drops among the Millennial generation (especially in the USA, where support for the suburbs is more than 40% lower than Generation X), then keeps going up as people get older.
Curiously, the group least likely to prefer the suburbs was Millennial Americans, with only 28% of people in this group answering as such.


Now watch what happens when we sort the data by people’s existing living situation:
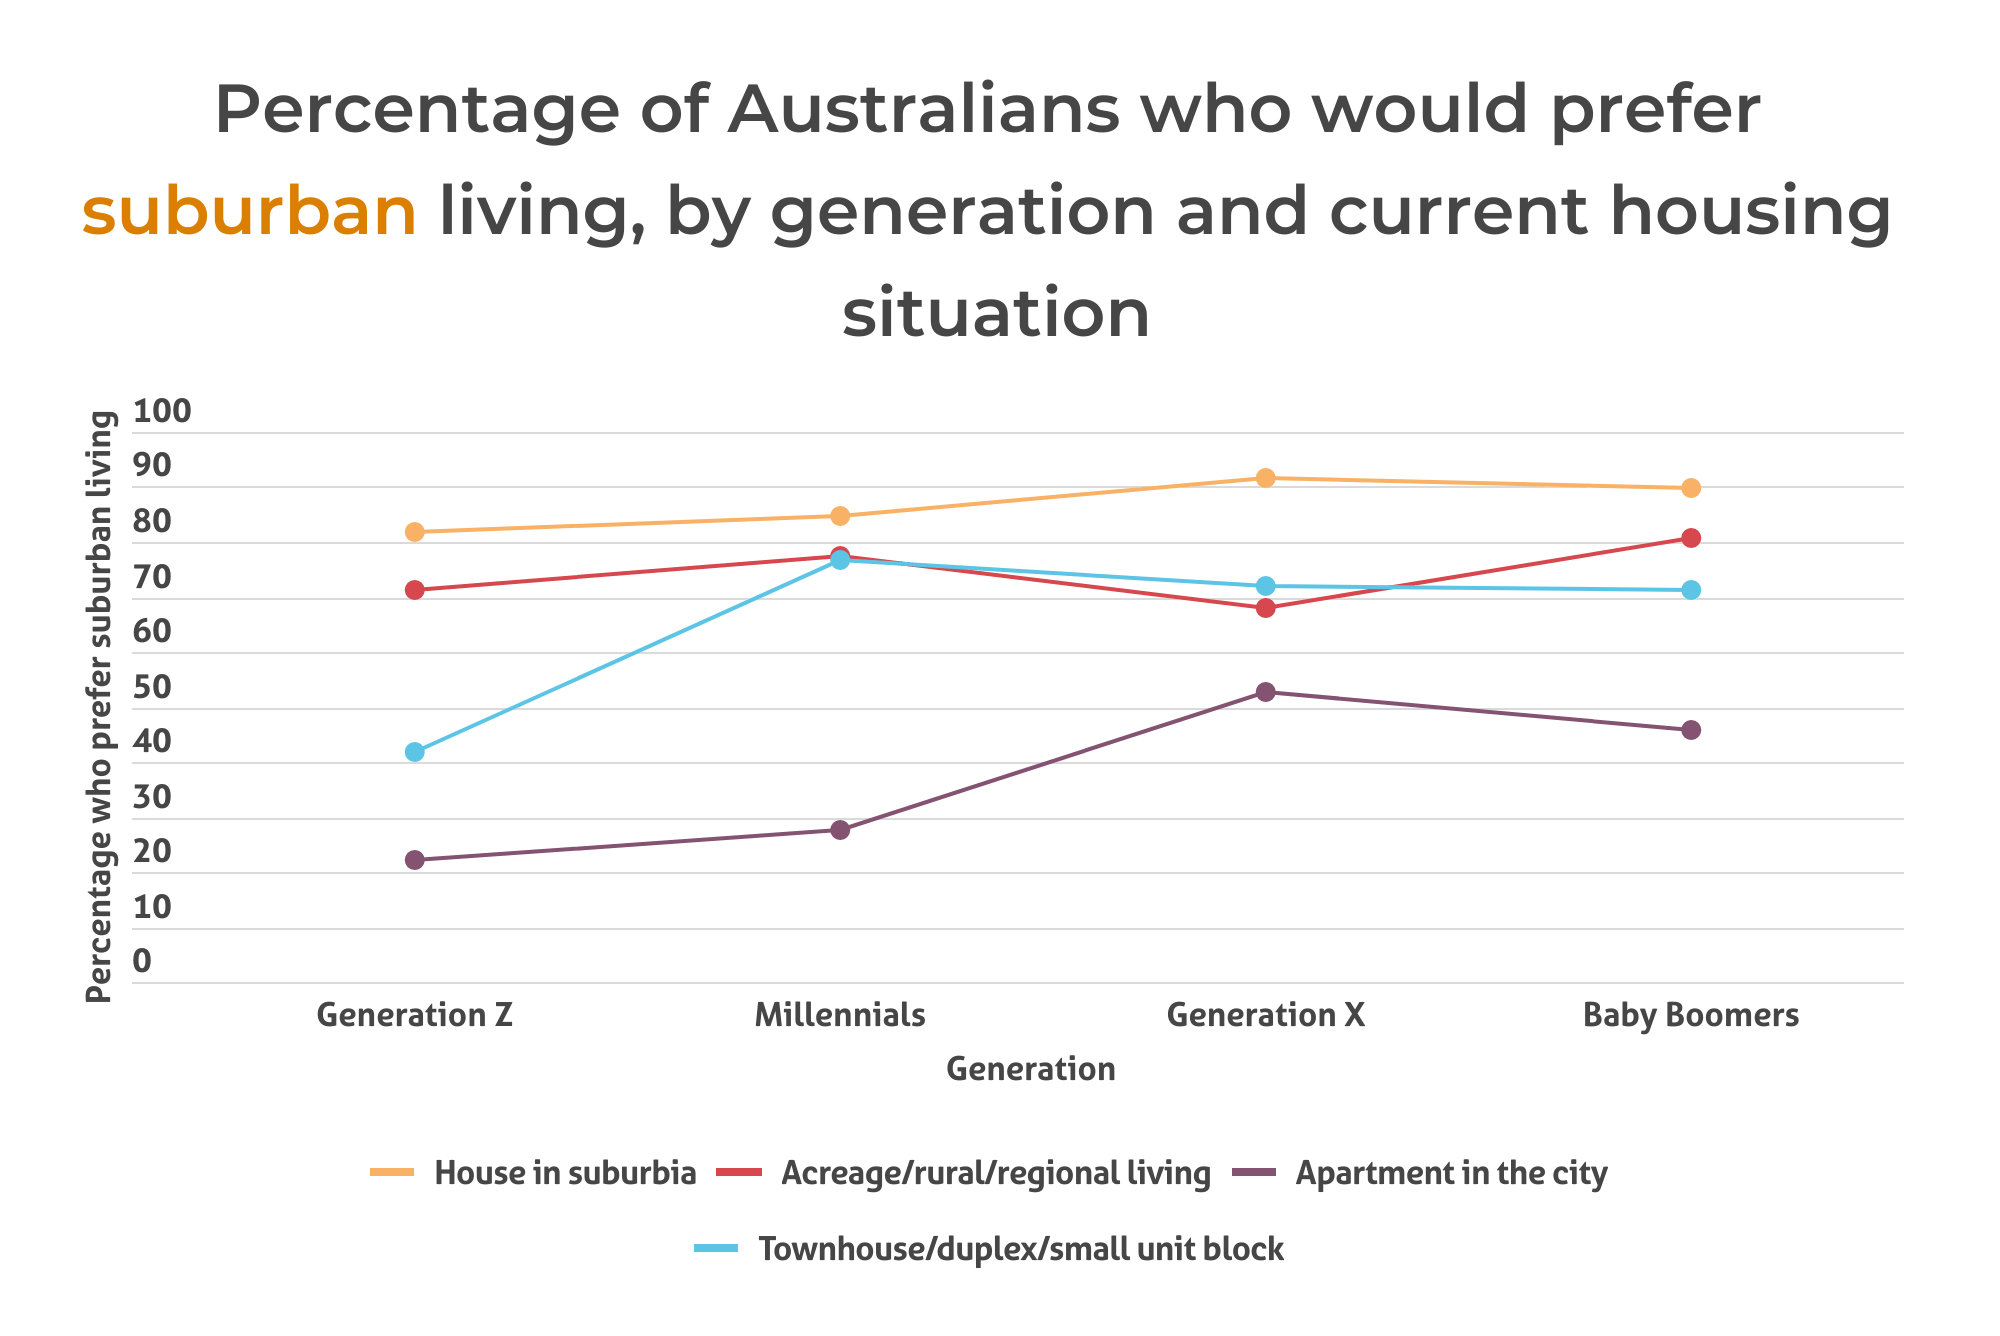
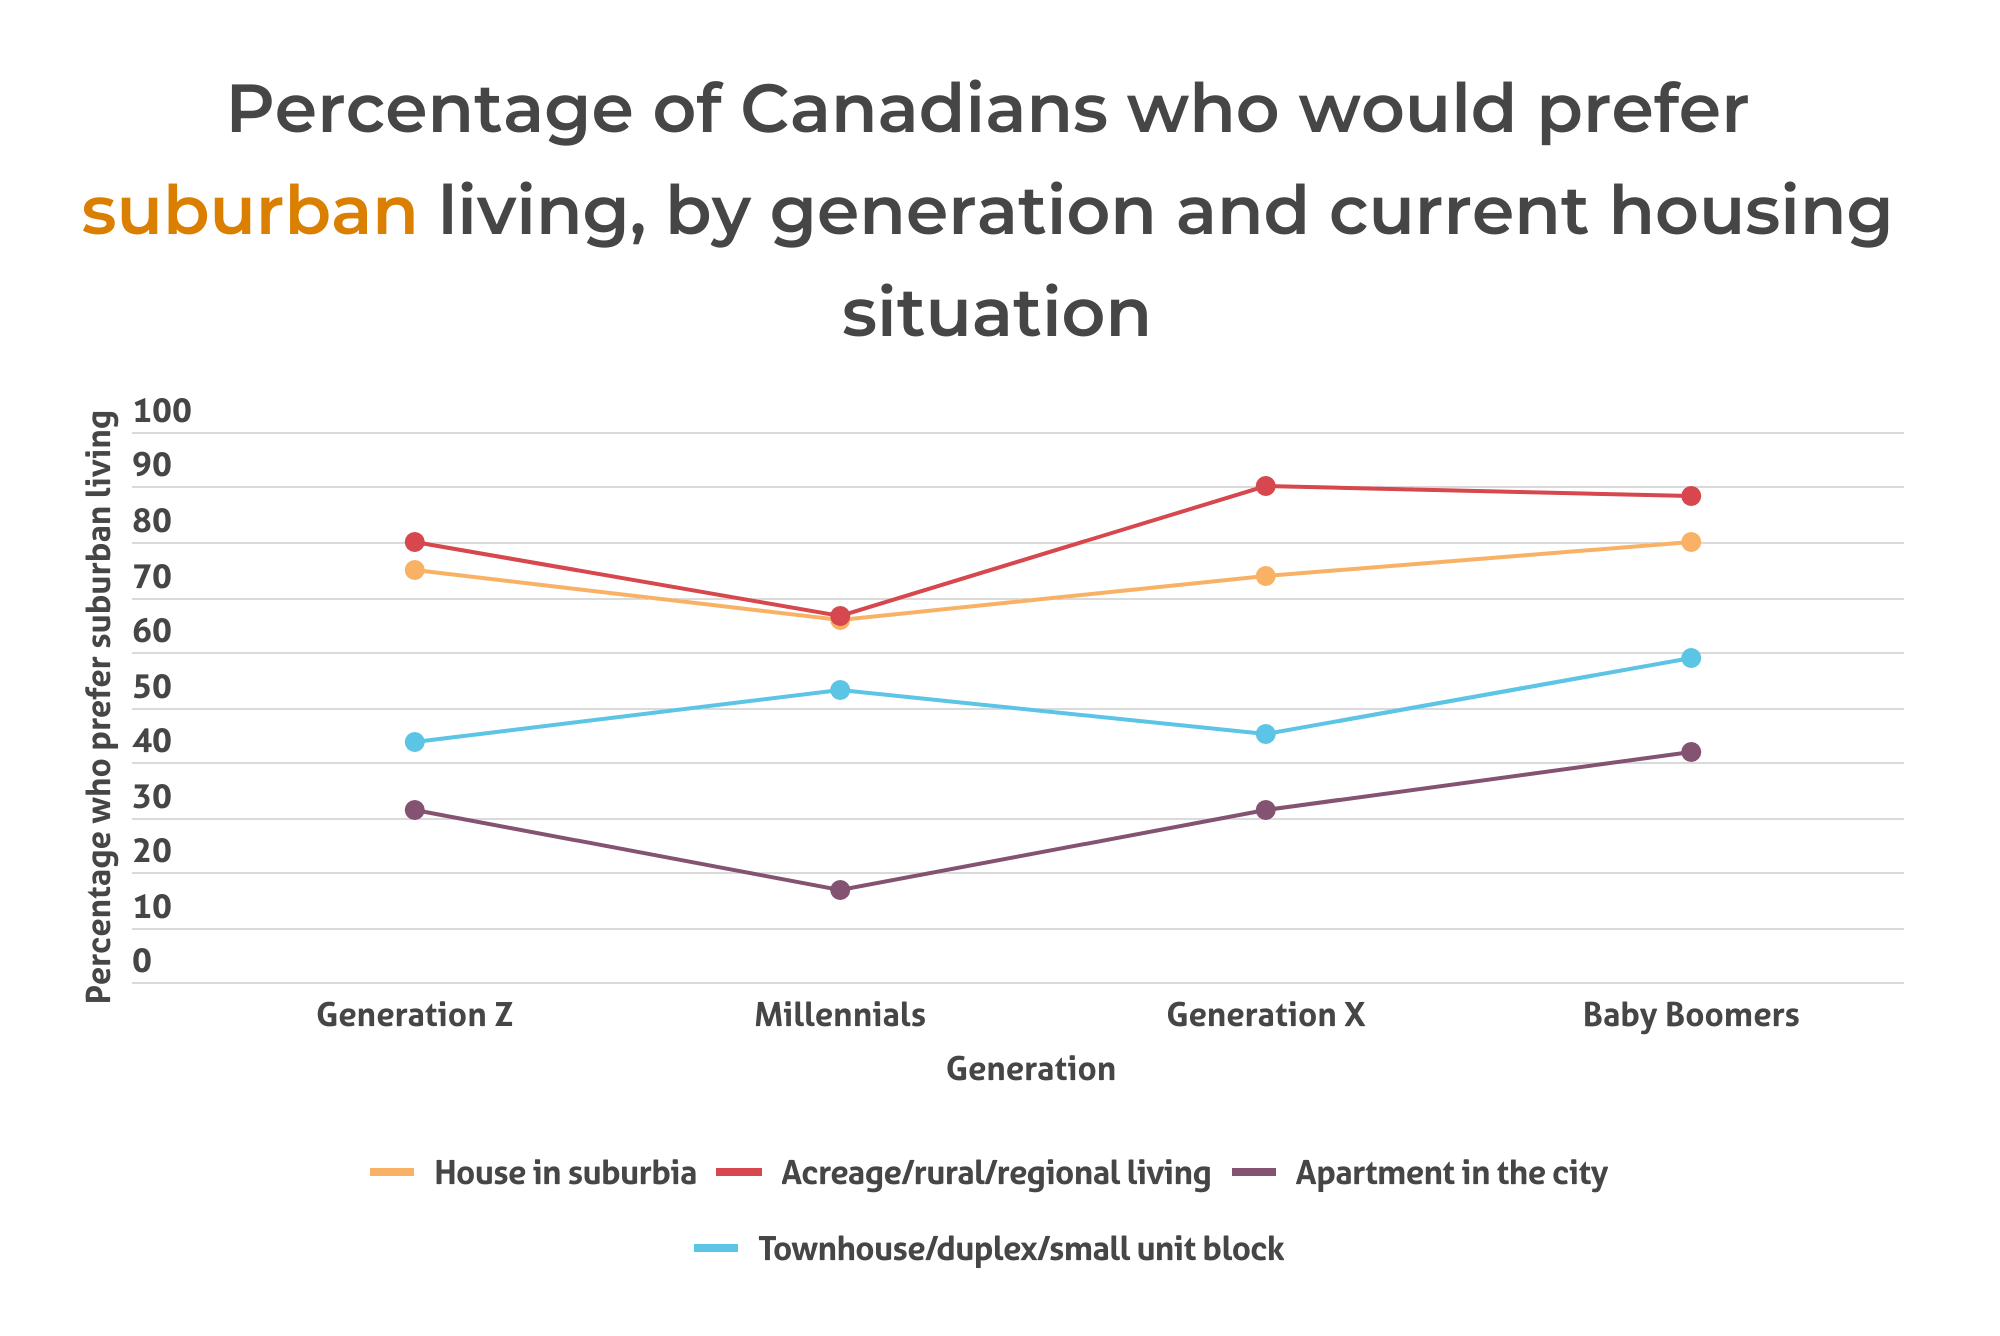
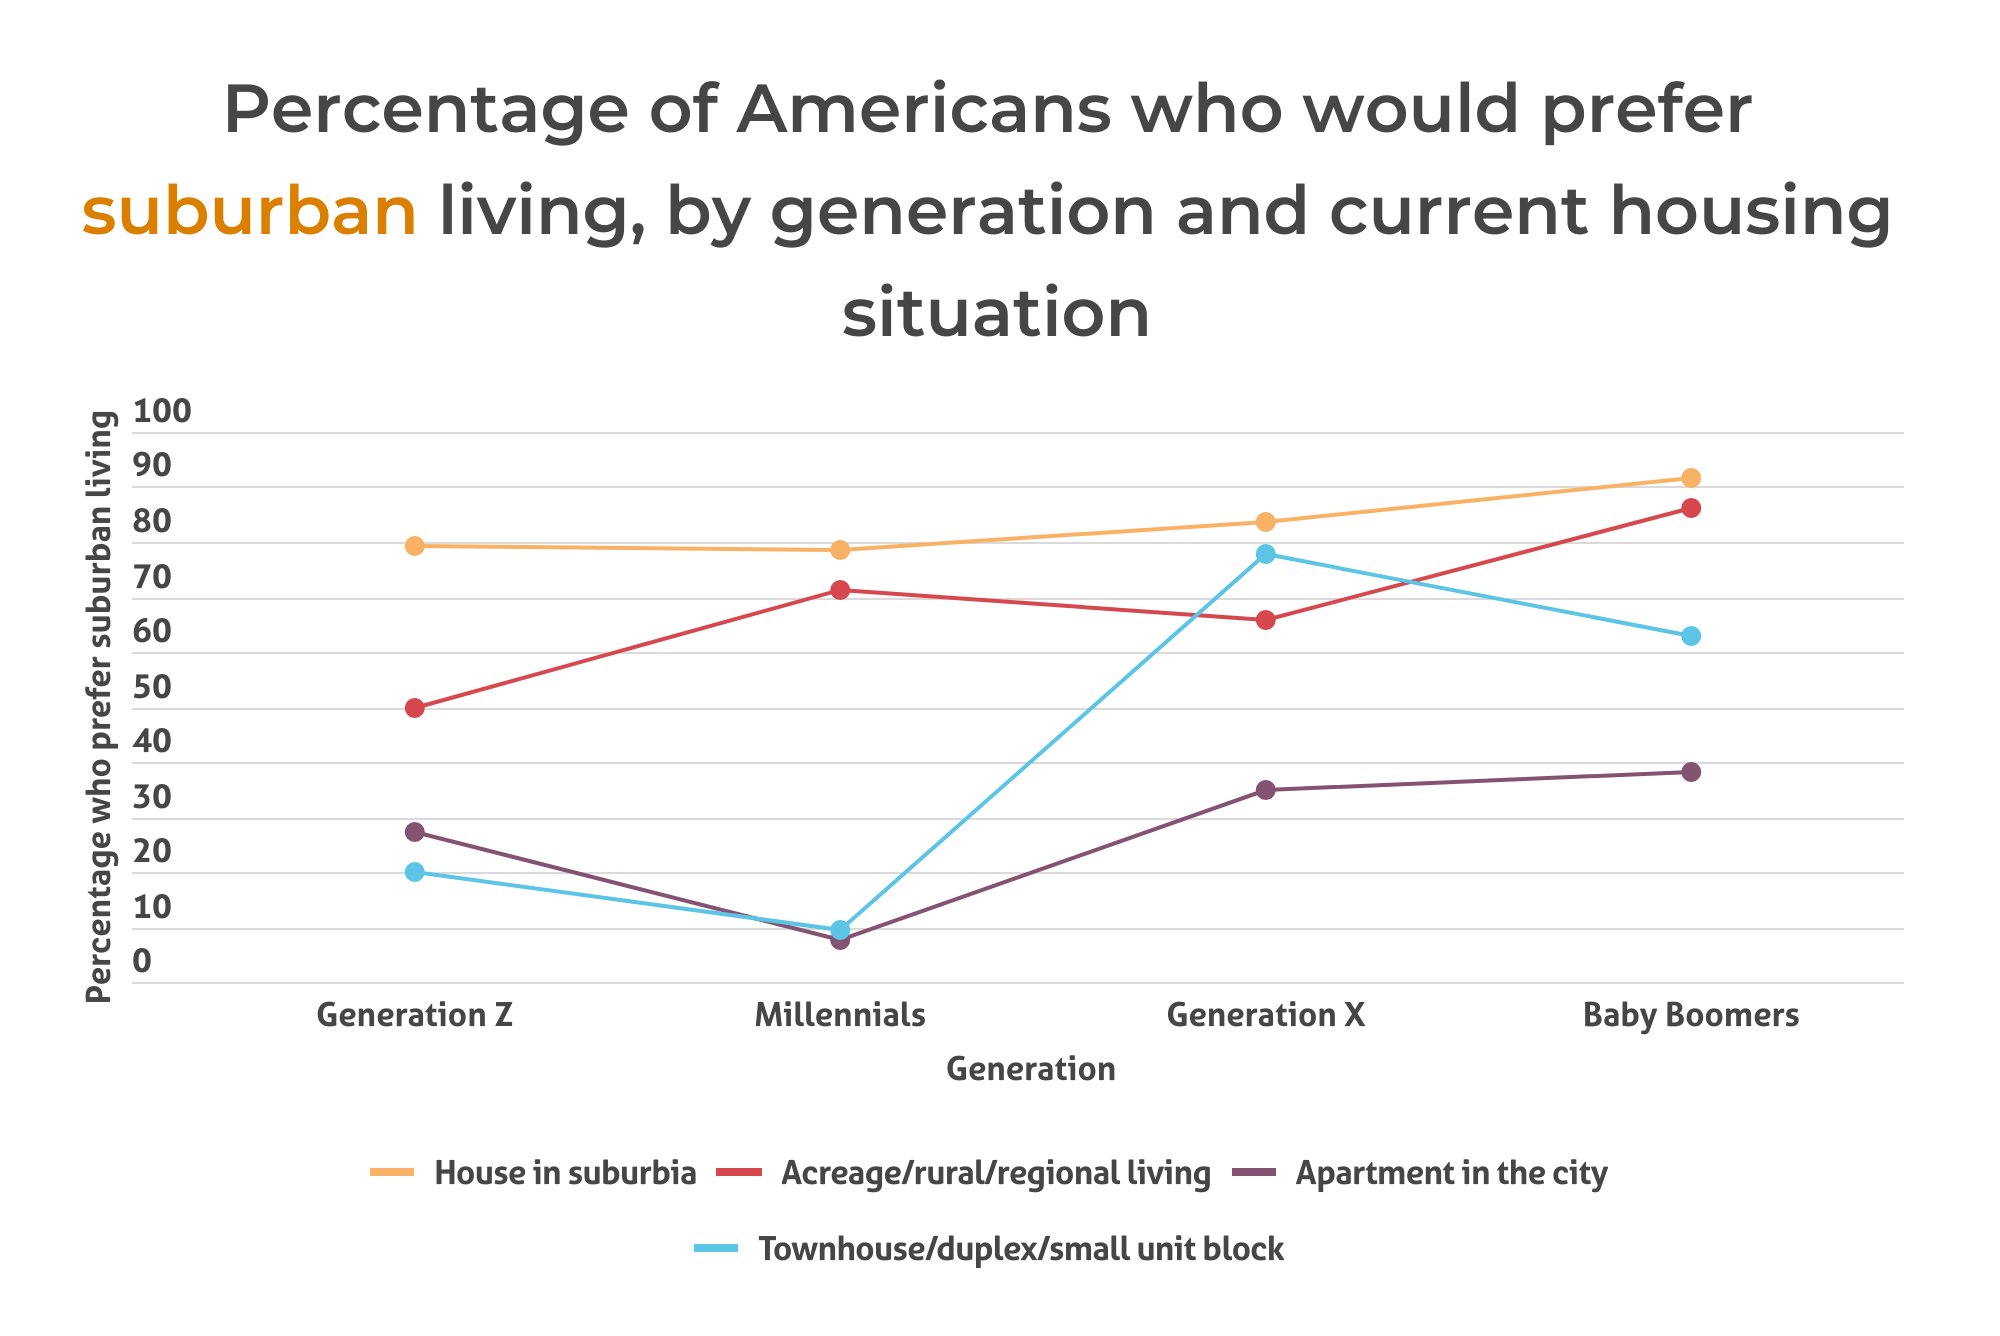

Perhaps unsurprisingly, people who already live in the suburbs (as well as those on acreage and in rural living) overwhelmingly prefer suburban living across all three nations (although support among this group seems to be marginally lower in Canada). In addition, people who live in city apartments prefer city living in most cases.
However the numbers get more interesting when we look at people who live in townhouses, duplexes or small unit blocks. This group is largely split over which living situation they prefer, especially in the States, where support ranges from just 9.4% for Millennials all the way up to 77.8% for Generation X – an almost 70% jump over just one generation!
Actually, this trend of Millennials disliking the suburbs is consistent across both the States and Canada. Americans living in suburbia, townhouses and city apartments; as well as Canadians living in suburbia, acreage, and in city apartments all saw decreases in support for the suburbs in the Millennial age group. This trend didn’t extend to Australia, however.

We also asked people how they would feel if they had to live in the living situation they didn’t choose. I.e. if they preferred the suburbs, would they be happy living in the city instead, and vice versa?
Let’s start by looking at the people that preferred the suburbs.
| Yes | Mostly | Don’t care | Not Really | Not at all | Both options would be miserable | |
| Australia | 20.1% | 24.0% | 15.9% | 24.1% | 13.7% | 2.2% |
| Canada | 17.9% | 27.9% | 15.1% | 23.0% | 14.1% | 2.0% |
| The USA | 18.8% | 23.2% | 12.9% | 29.1% | 12.9% | 3.0% |
Across all three nations, the opinion is relatively split. People tend to congregate around “mostly” or “not really” being happy but are not committing strongly one way or the other. Americans would be the most unhappy overall (a combined 42.1% said they wouldn’t be happy), while Canadians seem to be the most open to the alternative (45.8% said they would be happy, in total), but the differences between nations here are pretty small.
Now, let’s compare this to the people who said they would prefer city / central living:
| Yes | Mostly | Don’t care | Not Really | Not at all | Both options would be miserable | |
| Australia | 30.0% | 34.5% | 13.9% | 17.9% | 2.7% | 0.9% |
| Canada | 35.2% | 26.2% | 16.7% | 13.9% | 5.7% | 2.2% |
| The USA | 42.2% | 30.8% | 10.0% | 9.6% | 4.9% | 2.6% |

Instead of the decently even spilt we saw before, the trend here is immediately apparent. People who prefer city living generally seem to be more open to the idea of living in the suburbs. This trend is clearest in Canada and the USA, whereas the Australian data still shares some semblance with the previous results. In fact, Australians seem the least likely to be happy in this case, with a combined 20.6% saying they would be unhappy in the suburbs. On the other hand, a staggering 73% of Americans who prefer city living said they would also be happy living in the suburbs instead.
When we broke down all this data by age group, we found something interesting. In every nation, for both preferences of living situation, Generation Z and Millennials were always the two groups that were most likely to be happy living in the other property. Similarly, Baby Boomers were almost always the least likely to be happy overall. The only exception to this was Canadians that prefer city living, where Boomers were the second least likely to be happy, barely after Generation X.
This could imply that older people generally know what they want out of a home, whereas younger people are more willing to make compromises in terms of their living situation.

So what exactly are the reasons people chose one living situation over the other? Let’s find out, starting with the suburb-lovers:
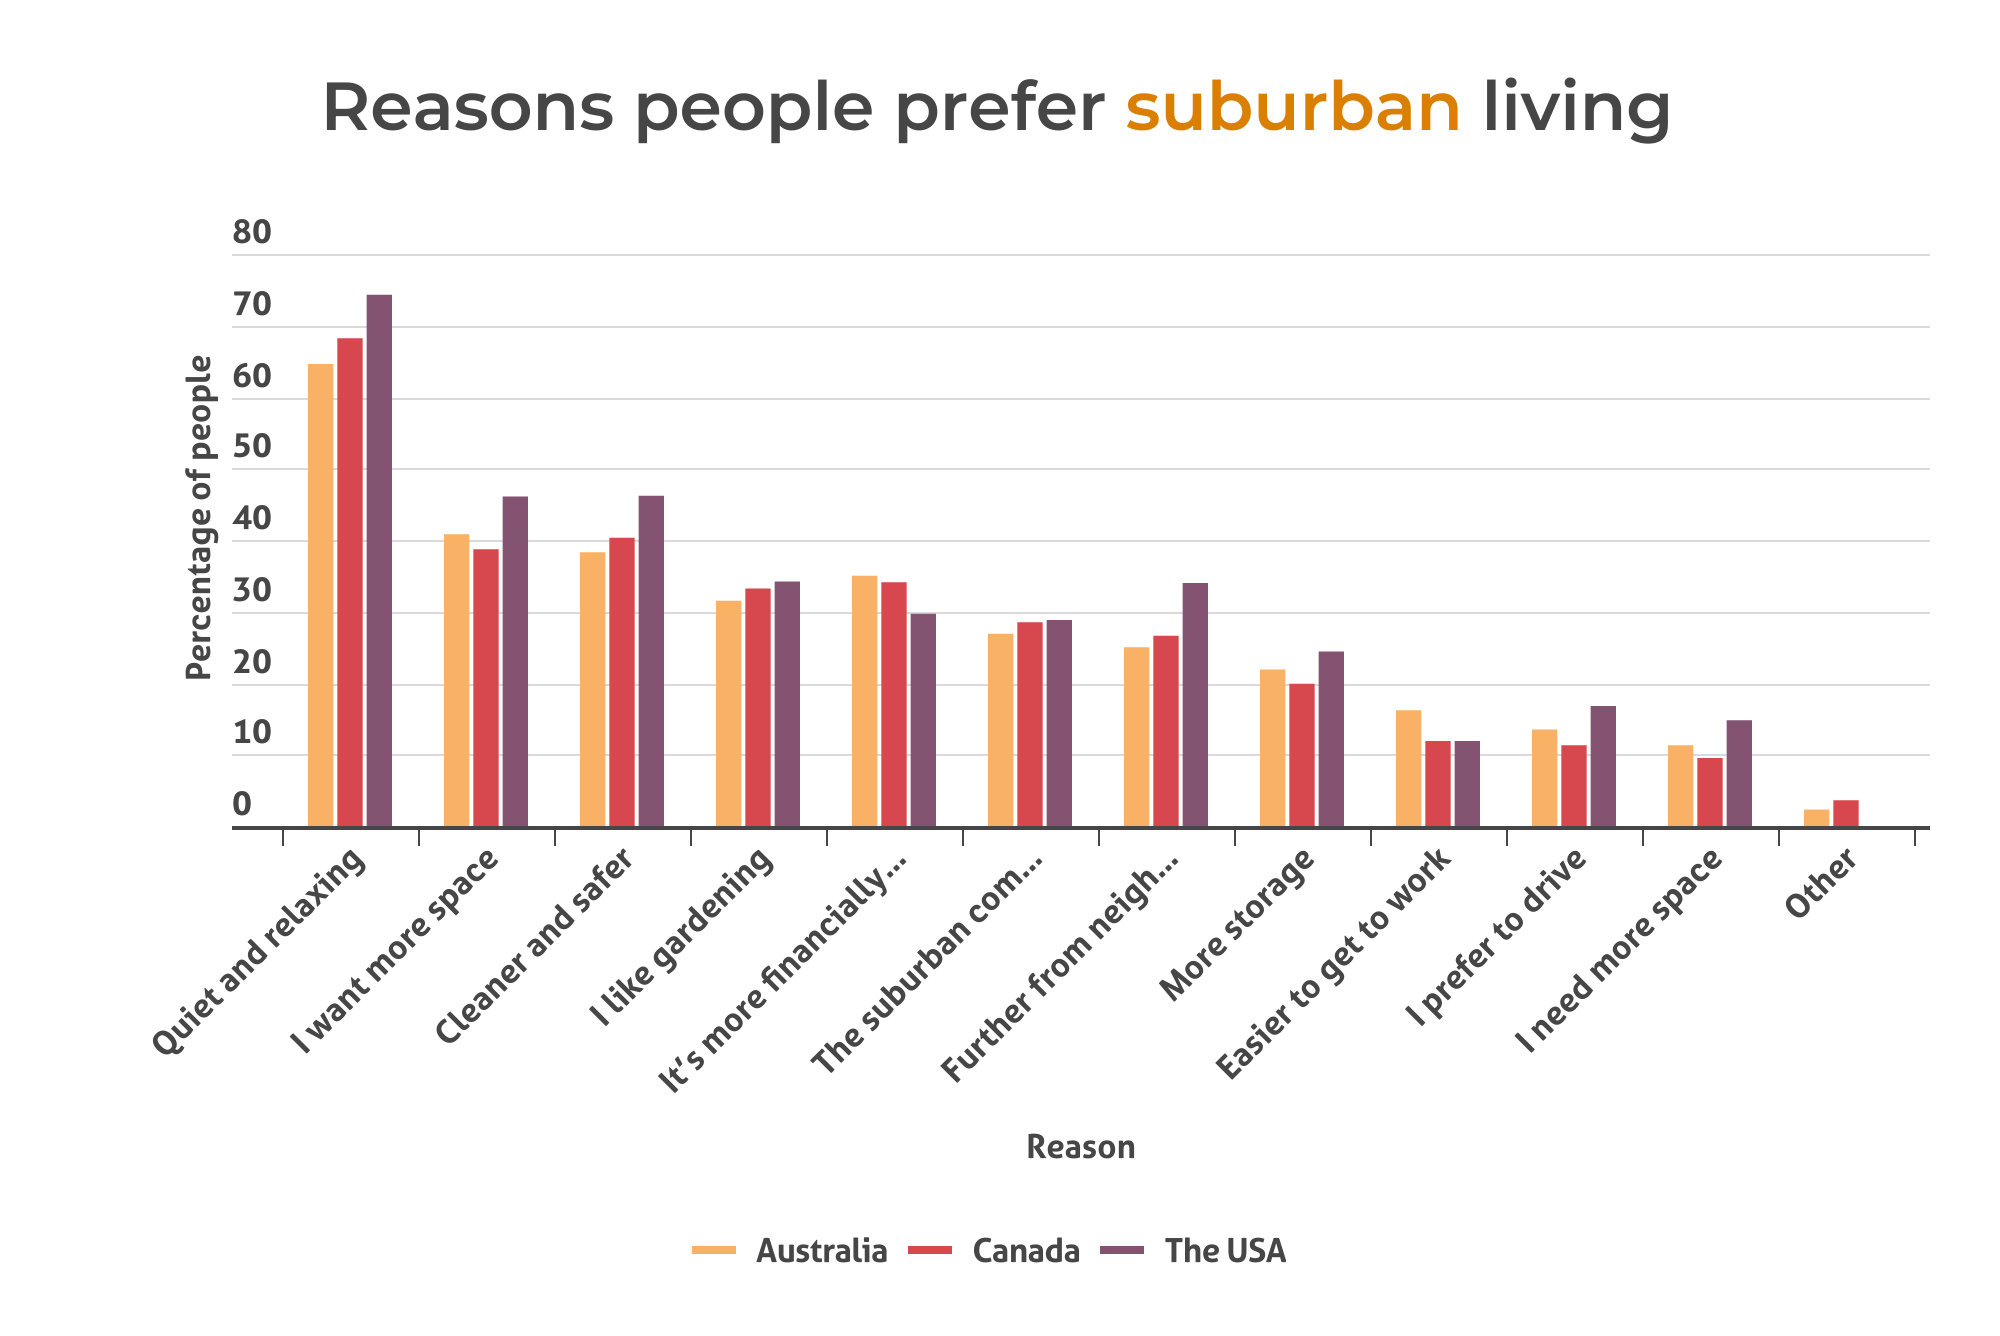
Immediately, we can see the most common reason across all three nations was that people think the suburbs are quieter and more relaxing. Meanwhile, people wanting more space and people thinking the ‘burbs are cleaner and safer were the second and third most common responses overall.
Interestingly, older generations were consistently more likely to choose each of these options than younger generations, in all three nations. Boomers were also roughly twice as likely as Gen Z to say they liked gardening (roughly 40% compared to roughly 20% respectively)!
In fact, the only areas where Gen Z consistently had a higher preference than Boomers was “easier to get to work” and “I need more space.”
On the other hand, there was much less of a consensus on why people preferred to live in central / city locations.
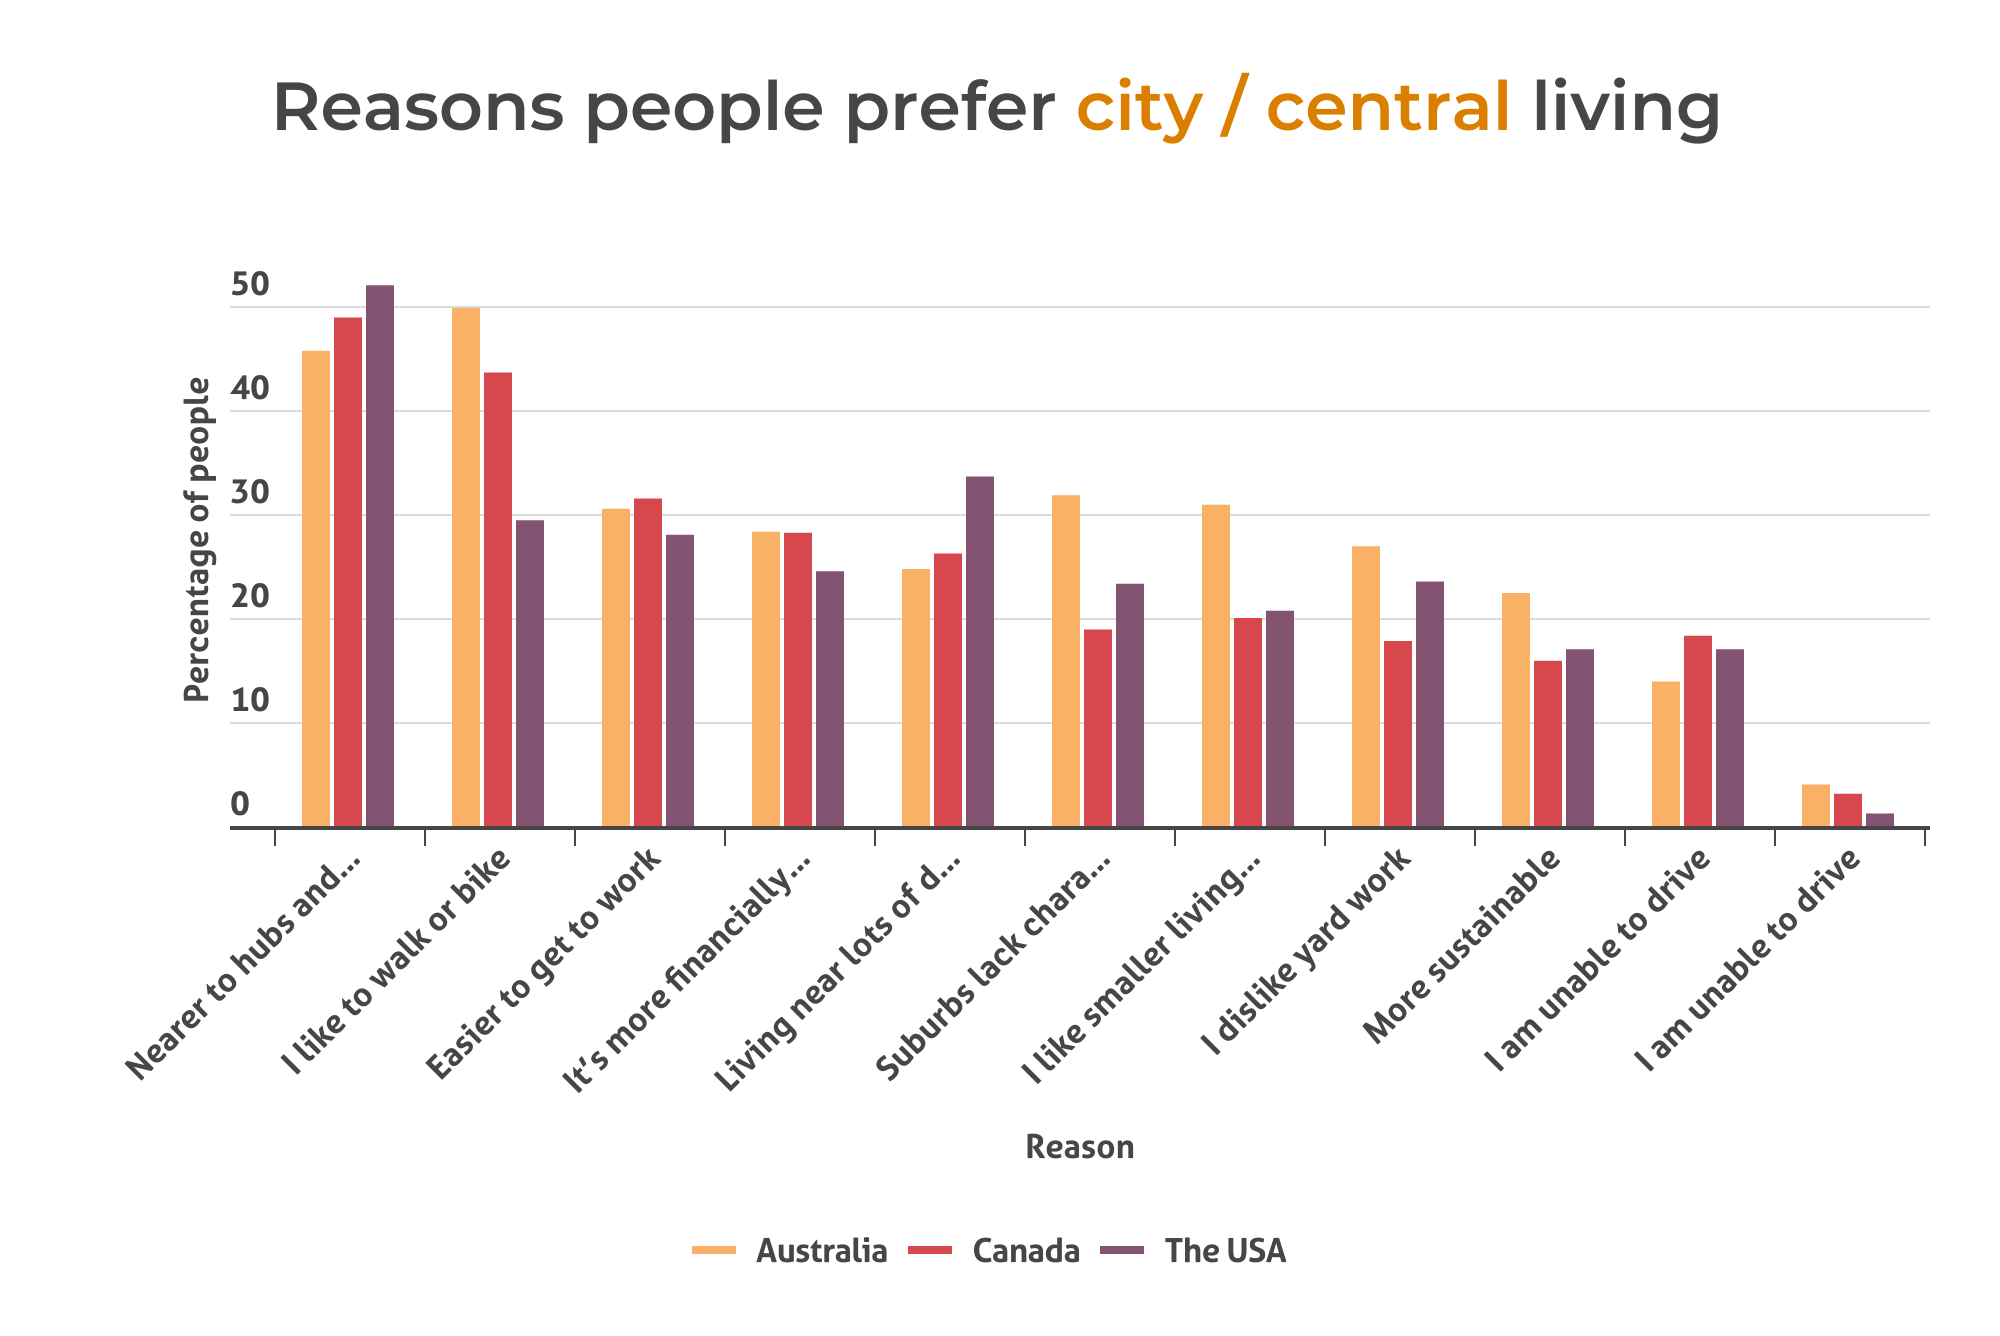
The two most common reasons people prefer city living in Australia and Canada was being nearer to hubs and public spaces and that people like to walk or bike. However, in the USA, being near public spaces is the clear number one priority, followed by living near lots of different people.
Breaking the data down by age, we noticed that Baby Boomers in Australia and Canada were more than twice as likely as Gen Z to want to live near hubs and public spaces (approximately 30% vs 60% in both cases). However, interestingly, American Gen Z-ers were about 10% more likely to choose this than their Boomer counterparts (55.4% and 45.6% respectively).
Another fun fact: 24.3% of Gen Z Americans answered “all of the above” to this question – more than three times higher than any other group! We can’t say for sure why this is, but it sure seems that many young people in the USA align strongly with a city lifestyle!

Whether you seek city or central living, are searching for a suitable suburb, or just something different, it is important to shop around to help you find a suitable home loan for your individual circumstances.
Compare the Market’s General Manager of Money, Stephen Zeller, said comparing your options before you buy could help save you a lot of money in the long term.
“The home loan you choose can make a huge impact on your financial future – it just makes sense to know your options before you commit to one.
“Comparing different loans can also help you know your limits on what you can afford, and what you can’t, and ultimately help you identify something suitable that meets your needs so you can get into your dream home with ease,” Zeller said.
Compare the Market commissioned PureProfile to survey 1,003 Australian, 1,002 American and 1,002 Canadians adults in September 2023.
The various generations referenced in the piece correspond to the following age groups:
The wordings for the various reasons people chose their preferred living situation, and for how happy they would be in an alternate living situation, were both summarised for simplicity.
Results in the “all of the above” option for questions regarding why respondents chose their preferred living situation were added to each individual reason (except “Other (please specify)”) to better represent attitudes and trends in the data.
