The Burrow

We all like to think of our homes as a safe place for our favourite things, but in the event of an accident, anything could happen.
As home and contents insurance comparison experts, we surveyed more than 3,000 people across Australia, the USA and Canada to see who actually has contents cover for their household items, and whether they have kept that cover up to date.
Of those surveyed, Canadian households come in with the highest rate of contents cover overall, at a total rate of 82.3%, a slight lead over both Australia and America (78.5% and 76.6% respectively). Of these households with contents cover, Australians had the highest understanding of how much their contents were covered for at 39.6%, with 38.9% being unsure of their level of contents cover.
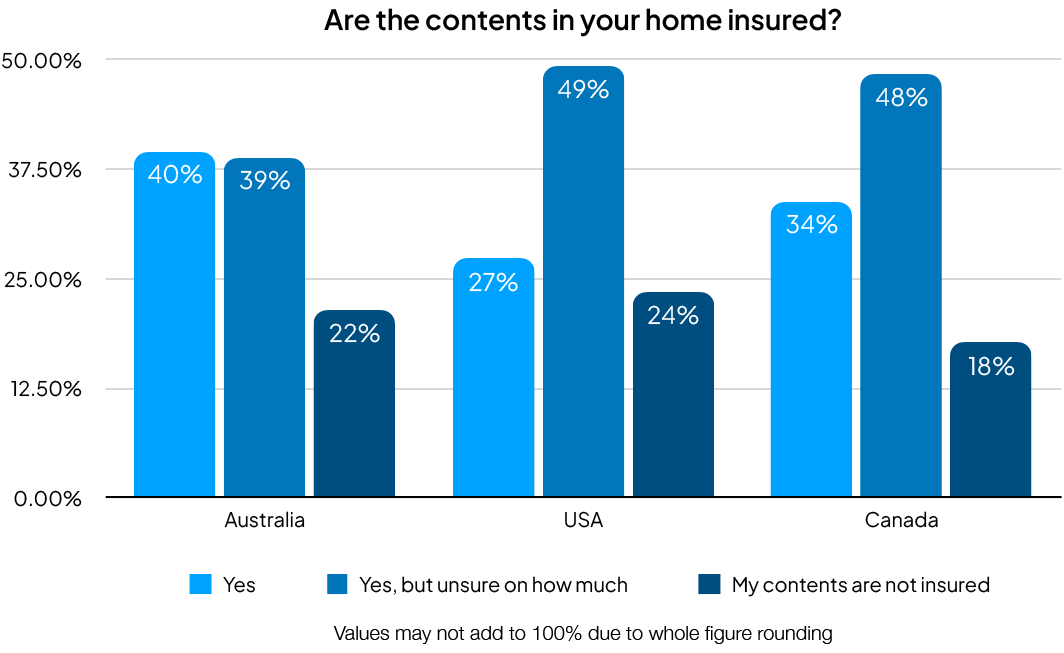
Let’s break it down country by country.
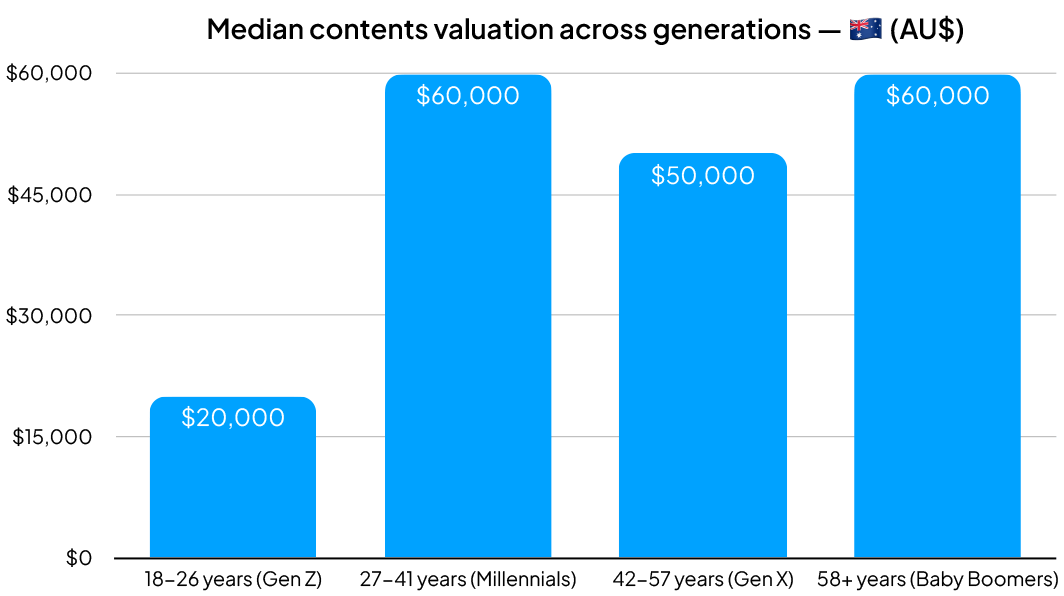
According to our survey, across the country, of those who do have contents insurance, the median amount that Australian households insure their contents for is AU$50,000.
Australians aged 27 and over typically cover their contents for an amount around AU$55,000, whereas Australians ages 26 and below reported a median contents valuation of AU$20,000.
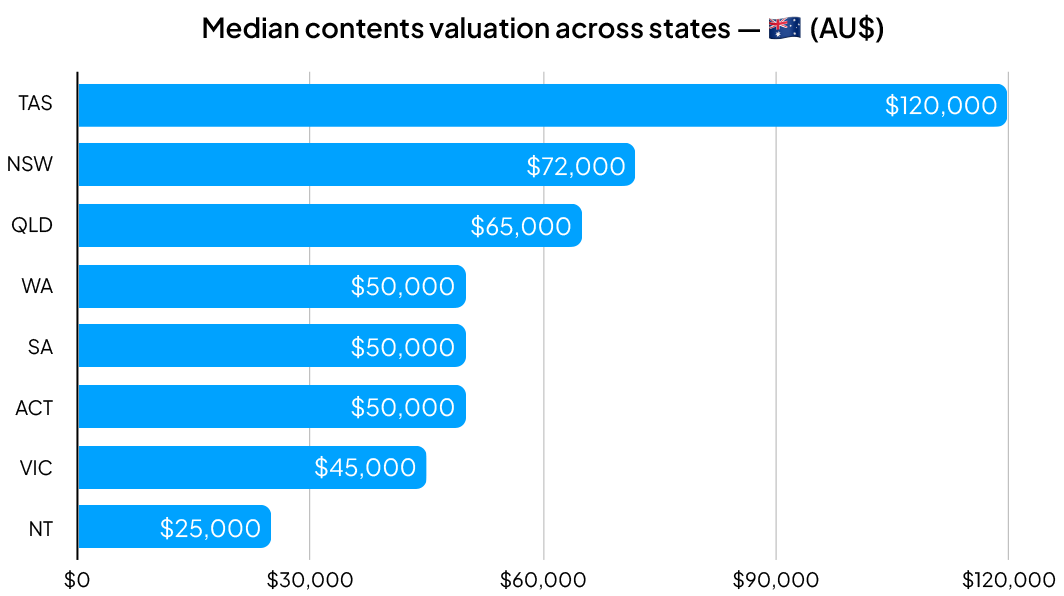
Across the Australian states, Tasmania jumped to the top with the highest contents valuation at a median of AU$120,000, a jump of AU$48,000 above the second highest, New South Wales, whose median contents valuation was AU$72,000.
21.1% of Australians surveyed reported having neither home nor contents insurance for their places of residence. Of those that do, 25.6% have not reviewed or updated their policy in almost a year and 7.9% have never updated their policy.
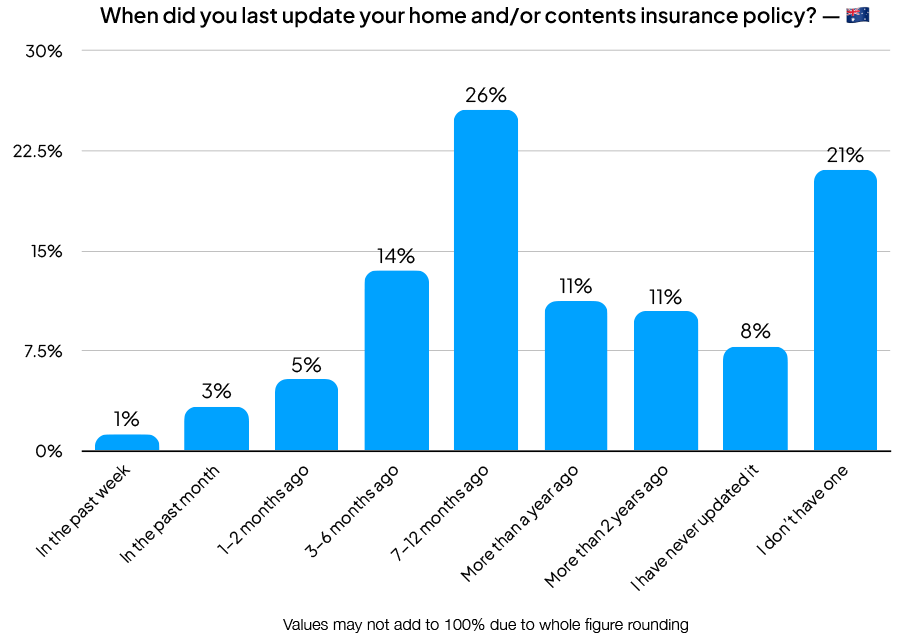
Young Australians aged between 18 and 26 years old were the most likely to not have any home nor contents cover, and if they do have cover, they were also the most likely to not review or update it. Conversely, Australians aged 58 years and over were had the highest propensity to actively review their cover, with 61.3% last updating their home or contents policy in the last year.
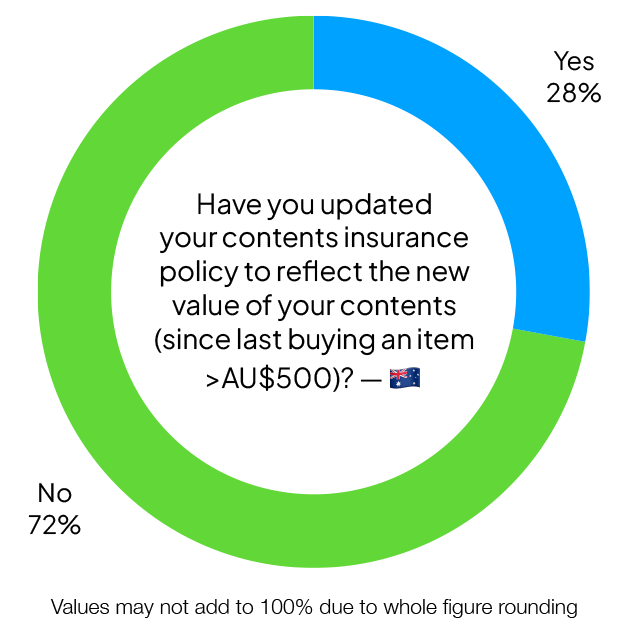
Within the last year, 60.9% of Australians surveyed reported buying a household item worth more than AU$500 with an additional 33.9% last buying one more than a year ago. Of these, only 27.9% updated their contents insurance policy to accurately reflect the new value of their contents.
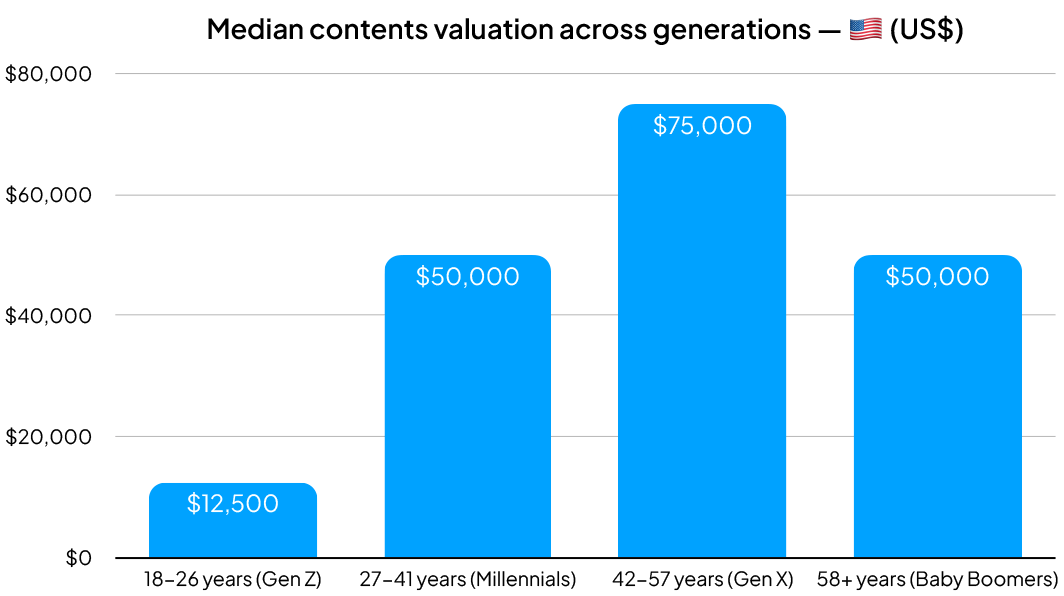
Of those surveyed in the United States, the median household contents valuation for contents cover is US$50,000. Similar to Australia, young Americans tended to have a lower contents valuation for their cover, with a median of US$12,500. Americans aged 42-57 reported the highest contents valuation at US$75,000.
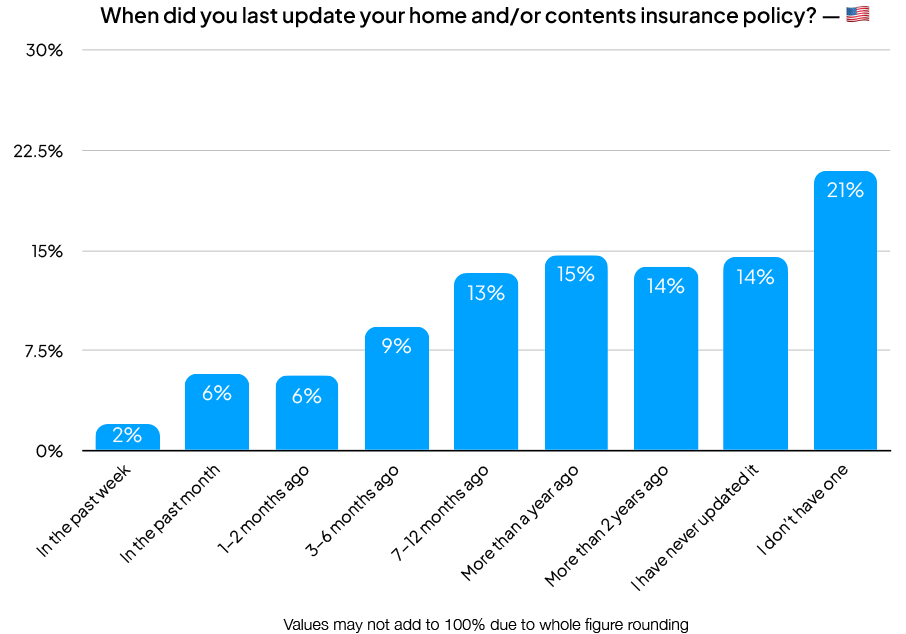
The majority of Americans who have updated their home or contents policies since first taking them out reported having not touched them in over a year. 21% of Americans surveyed report having neither type of policy, a very similar figure to Australia, while 14.5% of Americans surveyed reported having never updated their policy.
Contrary to Australians, young Americans reported the highest rate of home or contents policy cover, with 15.6% of Americans aged between 18-26 years having neither cover. It was American Millennials (aged 27-41) who reported the lowest rate of cover, with 26.2% having none. Americans aged 58 years and older reported the lowest propensity to update their policies.
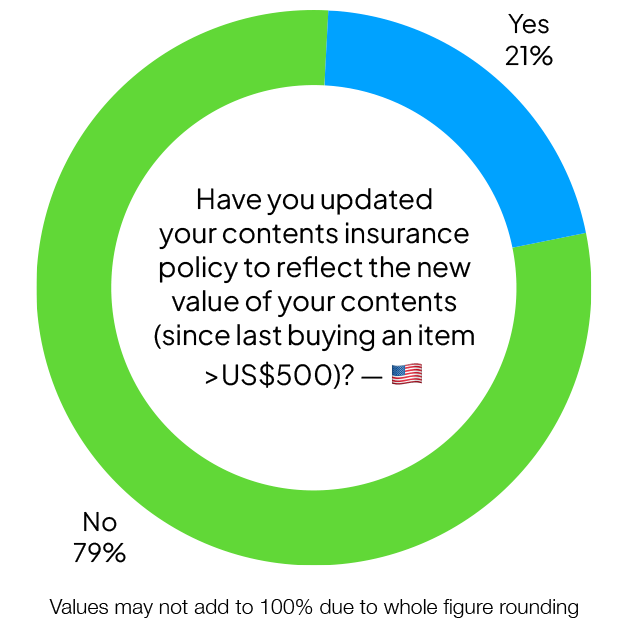
Within the last year, 47.8% of Americans surveyed reported buying a household item worth more than US$500. A further 15.3% of households reported buying this item more than a year ago, and 24.4% reported buying it more than two years ago. Of these households, only 21.0% reported updating their contents cover.
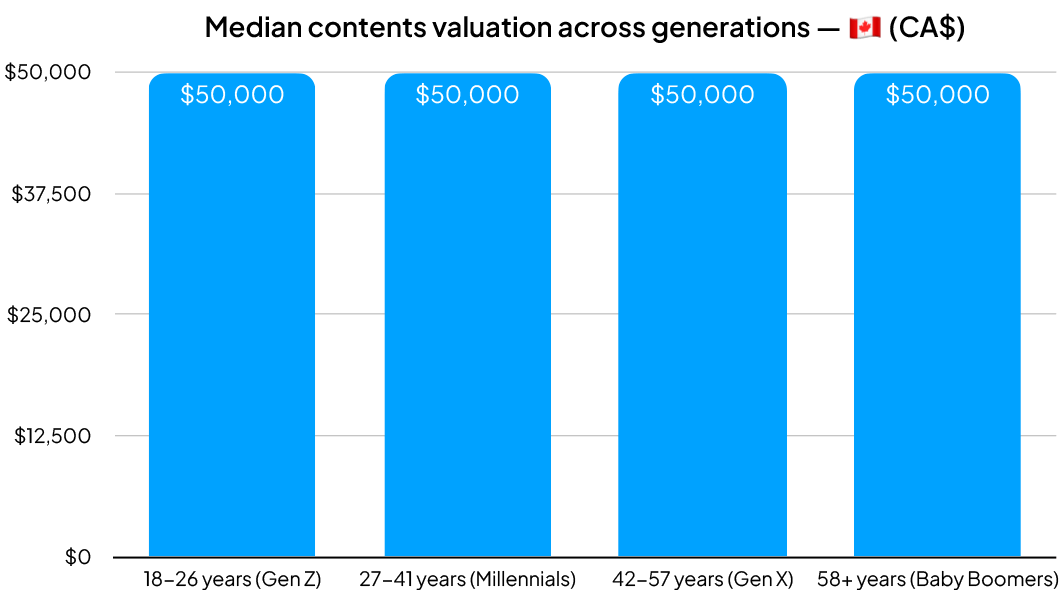
Canadians reported an average household contents valuation of CA$50,000. Breaking away from the trend set by both Australians and Americans surveyed, each age bracket reported the same median contents valuation of CA$50,000.
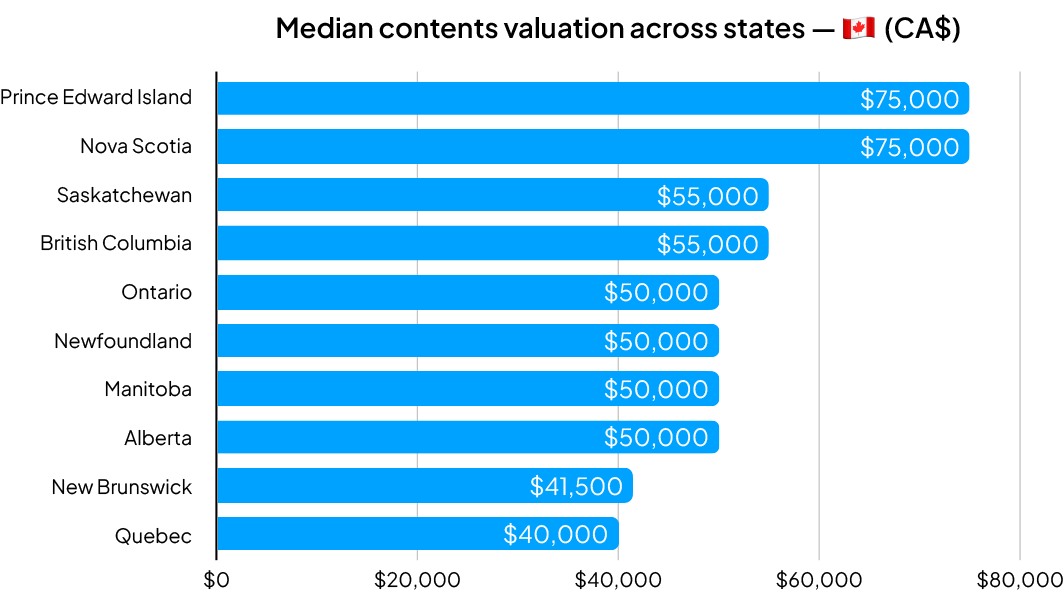
When broken down by provinces and territories, the median contents valuations remain close to CA$50,000. Quebec and New Brunswick households reported median contents lower than the national median, at CA$40,000 and CA$41,500 respectively. Conversely, Prince Edward Island and Nova Scotian households reported the highest at CA$75,000.
Canadians surveyed reported having home or contents insurance at a rate of 85.8%, the highest of any of the countries surveyed. Of those with contents insurance, 21.3% last reviewed and updated their policy around a year ago.
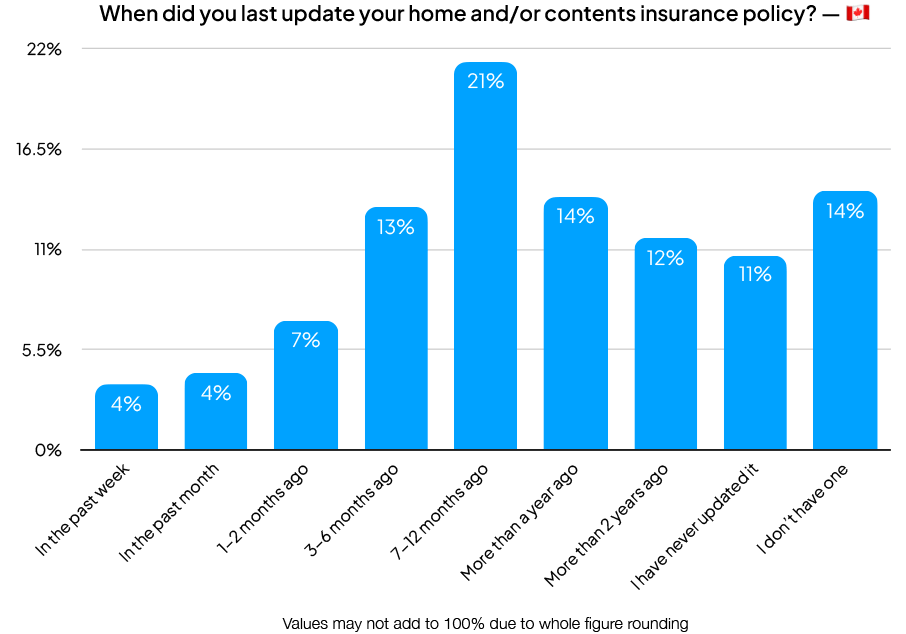
Across the age brackets, about half of the Canadians surveyed were consistently looking to update their contents policy. Older Canadians were typically more likely to have home or contents cover than their younger counterparts, with 88.4% of Canadians aged 58 and up having some form of home or contents cover, compared to 81.6% of Canadians aged between 18-26.
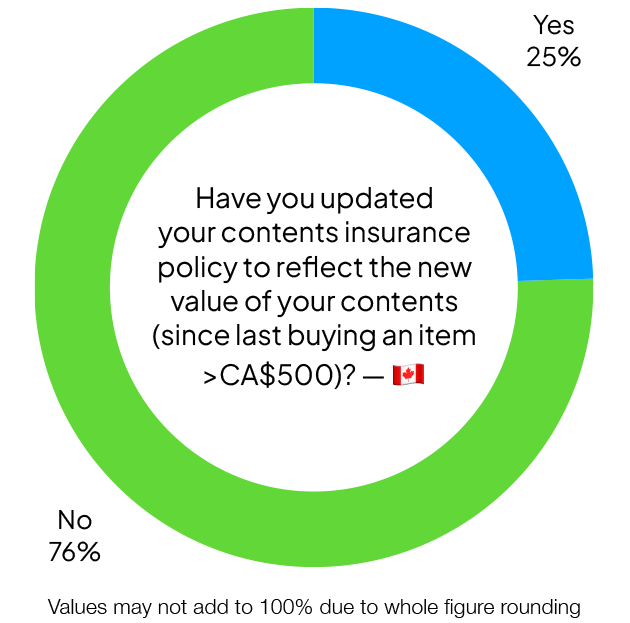
Of those Canadians surveyed, over half (56.5%) reported buying a household item worth CA$500 or more within the last three years. An extra 15.4% of Canadian households reported buying an item of this value more than a year ago, and 19.1% purchased an item of this value more than two years ago. Of these, just 24.50% updated their policy’s contents valuation.
Compare the Market’s Executive General Manager of General Insurance, Adrian Taylor, notes the importance of accurately assessing the value of your contents when taking out contents insurance.
“It’s good to see that, of those surveyed, the majority of households have some form of home or contents insurance,” Mr Taylor said.
“Contents insurance can provide homeowners and tenants peace of mind.
“When taking out contents insurance, it’s important to accurately assess the value of your household items to ensure that you are properly covered.
“Underinsuring your belongings could result in your insurance payout being less than the loss you suffered.
“The same goes for anyone taking out home buildings insurance. It is important to ensure you have an understanding of rebuilding cost in order to stay properly covered.”
Always read the Product Disclosure Statement (PDS) and Target Market Determination (TMD) to check for the inclusions, limits and restrictions before purchasing to make sure the product is suitable.
Compare the Market commissioned PureProfile to survey 1,005 Australian, 1,005 American and 1,005 Canadians adults in September 2024.
All figures and percentages rounded to one decimal place. As such, some percentages do not equal 100%.