The Burrow

May 20, 2024
Our home is our refuge, and it can be devastating to come home and find that it has been broken-into. It can make us feel like nowhere is safe.
But is this really the case? Are there some places out there which are better for home security?
As experts in home and contents insurance, we wanted to see which countries have higher rates of theft, how many people use home security devices, and how worried people are about potential break ins at their home.
We gathered data for 19 countries to find out which ones are safer, and which ones have a home security problem.
Here are the findings.
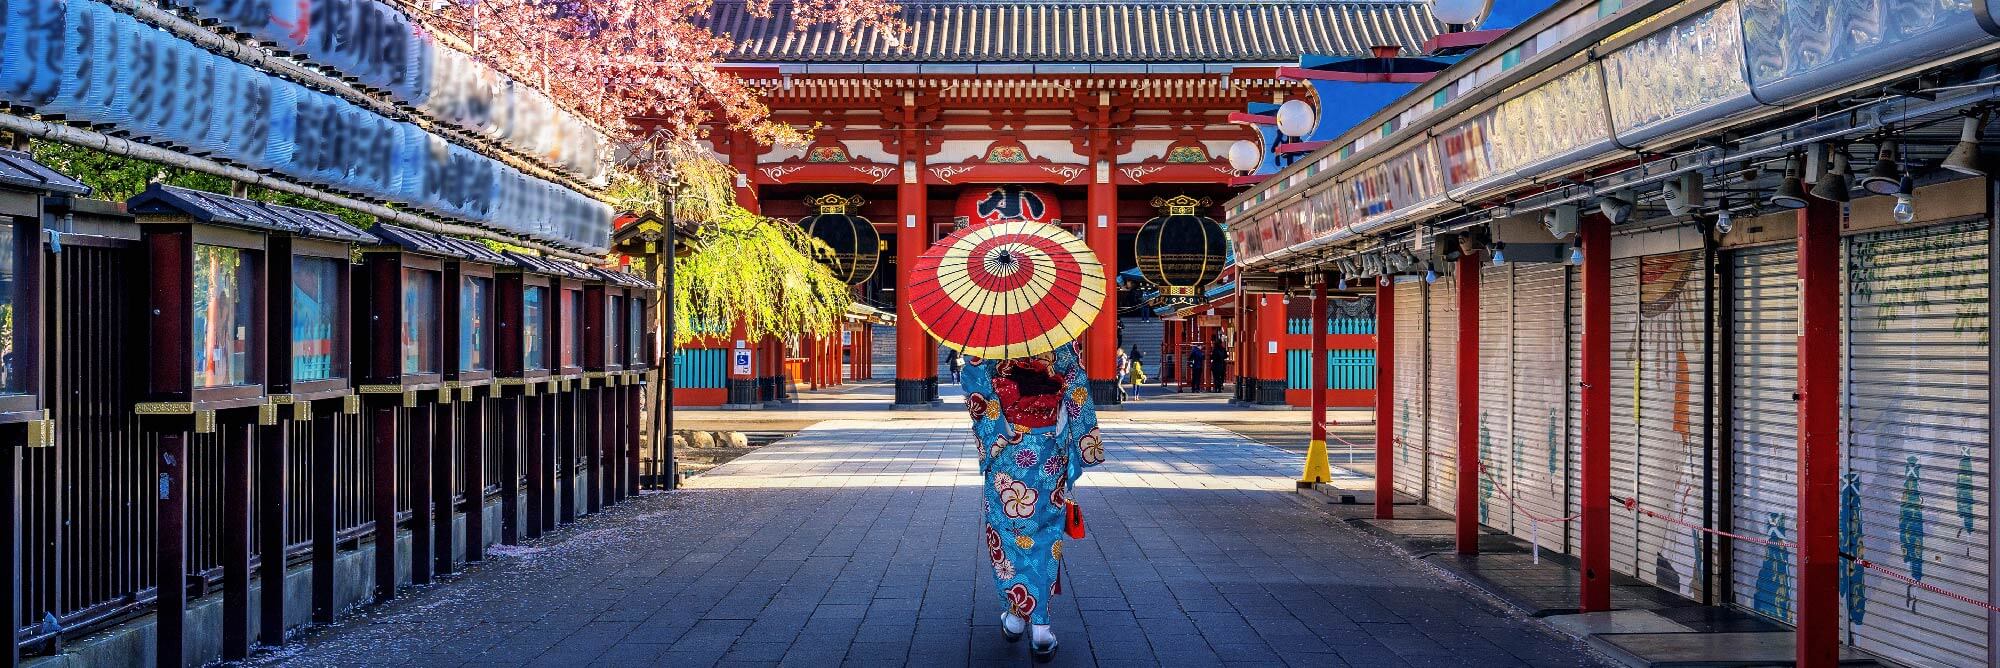
Coming on top of our index is Japan with a score of 9.26/10. Japan is renowned for its safety and this applies to home security as well, with a burglary rate of 35 per 100,000 people – the lowest in the entire index. Japan also has the second-lowest break-in concern score of 19.81.
Perhaps because people in Japan are not concerned as much about break-ins due to such a low burglary rate, they may not see as much need for home security devices. Only 15.9% of homes in Japan are estimated to use smart devices for home security like cameras and alarms.

Second on the list with a score of 8.71/10 is Finland, which is well regarded as a safe country to live in. Finland had the third-lowest burglary rate of 141 per 100,000 residents, and the lowest break-in concern score of 19.00. Almost 18% of Finnish homes have smart home security devices, which is the sixth-lowest amount in the index.
Combined with the low burglary rate and low break-in rate, it isn’t surprising that Finland’s usage of home security device is so low in comparison to most countries on the list – there is simply less need to.

Spain rounds out the podium, scoring 7.41/10. Spain had the lowest percentage of homes using smart home security tech at 9.0%, and the sixth-lowest burglary rate at 284 per 100,000, beating out the Netherlands, Norway and Germany.
However, out of the 19 countries Spain had a break-in concern score of 34.16, which was the 10th highest. This concern appears to have no effect on the number of households adopting smart home security devices.

New Zealand had the worst score in the Home Security Index at 1.30/10. The island nation had the highest burglary rate per capita of 1,150 per 100,000 people, and the third-highest break-in concern score at 47.36. As such, it isn’t surprising New Zealand had the sixth-highest adoption rate of smart home security devices, with 41.9% of households estimated to have installed smart security devices.
The high burglary rate, as well as increases in theft1 and retail crime2 have driven fears around burglaries and break-ins in New Zealand. This is surprising from a country which has been renowned for being friendly, down-to-earth and relaxed in comparison to others.

Faring a little better, the United Kingdom had the second-worst score at 2.04/10. The UK had the third-highest burglary rate per capita at 715 per 100,000 (Sweden had the second-highest at 783 per 100,000). Unsurprisingly, the UK has the fourth highest number of households with smart home security devices (45.2% of households). As for break-in concern score, the UK had the seventh-highest score at 43.49.
While there was a very small decline in burglaries (407,000 to 400,000 from 2022 to 2023), overall theft increased from 2,623,000 to 2,681,000 between September 2022 and September 2023.3 Earlier in March it was reported that Police in England and Wales have not solved any burglaries across half of England and Wales in the past three years, and this has exacerbated concerns around break-ins, crime and safety.4

The third lowest-scoring nation on our list is France, with an index score of 2.60/10. France’s burglary rate is the seventh-highest of the 19 countries (458 per 100,000), but had the highest concern about burglaries with a score of 50.28. Almost a third of French households have home security devices (32.8%), which is the ninth-highest in the list.
Recent French concerns over burglary and theft have risen since the COVID-19 pandemic. The lockdowns saw burglaries decline, but in two years (2020 to 2022) burglary rates returned to pre-pandemic levels.5
| Ranking | Country | Burglary rate per 100,000 people | Home security device usage (% of country) | Break-in concern score | Index score |
| 1 | Japan | 35 | 15.9 | 19.81 | 9.26 |
| 2 | Finland | 141 | 17.8 | 19.00 | 8.71 |
| 3 | Spain | 284 | 9.0 | 34.16 | 7.41 |
| 4 | Italy | 184 | 10.9 | 47.80 | 6.12 |
| 5 | South Korea | 50 | 60.9 | 21.57 | 6.11 |
| 6 | Canada | 364 | 16.0 | 41.39 | 5.74 |
| 7 | Switzerland | 380 | 37.9 | 23.89 | 5.38 |
| 8 | Netherlands | 285 | 47.0 | 25.46 | 5.19 |
| 8 | Austria | 544 | 23.2 | 25.97 | 5.19 |
| 9 | Denmark | 661 | 23.4 | 25.48 | 5.01 |
| 10 | Germany | 358 | 37.6 | 33.99 | 5.00 |
| 10 | Belgium | 409 | 15.6 | 46.10 | 5.00 |
| 11 | Norway | 290 | 59.2 | 27.53 | 4.27 |
| 12 | United States | 277 | 42.5 | 46.30 | 3.89 |
| 13 | Australia | 522 | 31.5 | 45.72 | 3.52 |
| 14 | Sweden | 783 | 28.5 | 41.63 | 3.34 |
| 15 | France | 458 | 32.8 | 50.28 | 2.60 |
| 16 | United Kingdom | 715 | 45.2 | 43.49 | 2.04 |
| 17 | New Zealand | 1,150 | 41.9 | 47.36 | 1.30 |
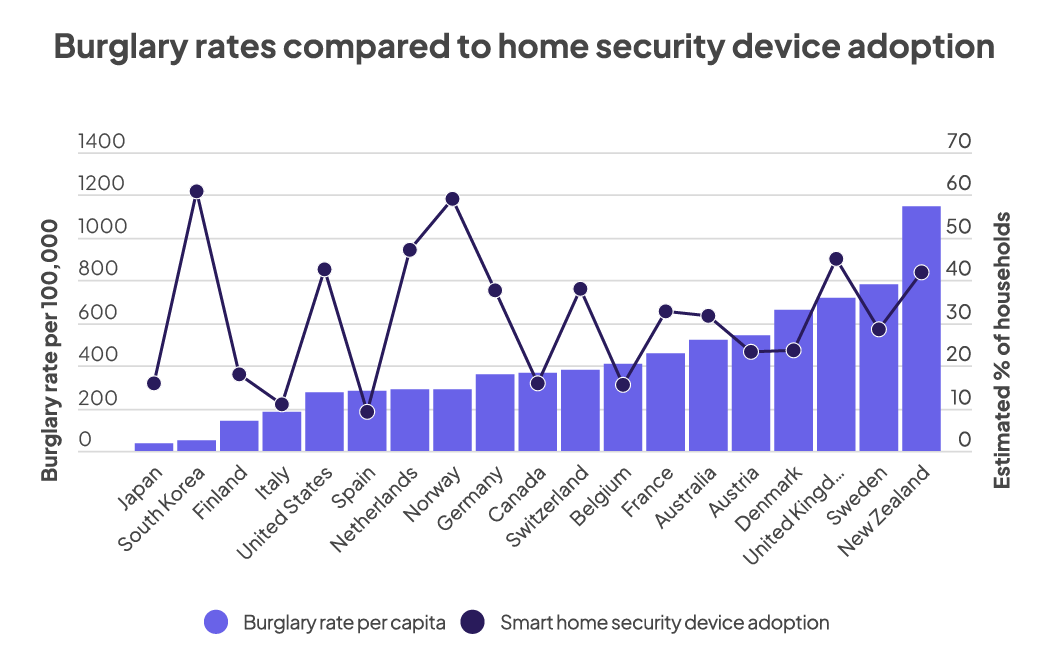
The line chart below focuses on burglary rates in comparison to smart home security device adoption. For countries with a low burglary rate, there is no clear trend in adoption of home security tech. For example, Japan, Finland, Italy and Spain have low utilisation rates of security devices, while other nations like South Korea, the United States, the Netherlands and Norway have very high adoption rates of security tech.
Looking at the right side of the graph, where burglary rates per capita increase, there does appear to be a similar increase in adoption of home security devices as well.
While the United States had the fifth-lowest burglary rate per capita, the USA had the fifth-highest percentage of households with home security devices, and the fourth highest break-in concern score. With all factors combined, the USA actually had the sixth-worst score in the Home Security Index with a score of 3.89/10.
Americans are clearly worried about having their home broken into, which is reflected in the high adoption of smart home security devices. It is also driven by extensive media coverage of the rise in shoplifting and theft from stores in several major American cities.6
However, while these thefts may heighten concern around crime, they are a different category of theft and not represented in home break-in statistics, which makes America’s burglary rate per capita appear surprisingly low in comparison.
Australia actually performed worse than America, but better than New Zealand and the United Kingdom, coming 13th once accounting for ties – the fifth-most bottom nation – with an index score of 3.52/10. Australia had the sixth-highest burglary rate per capita at 522, and the sixth-highest break-in concern score at 45.72. In turn, almost a third of Australian households have some form of smart home security device installed.
A major talking point in Australia in recent years has been youth crime. In 2022 to 2023 there was an increase of six per cent in the number of offenders aged between 10 and 17 – the first increase in youth offending since 2009, according to the Australian Bureau of Statistics.7 In the state of Queensland, where youth offending has become particularly notorious after a number of high profile crimes, nearly half of all youth offences were committed by serious repeat offenders in 2021 to 2022, according to Bond University.8
Home security devices may dissuade criminals from attempting to break into your home (or at least provide recordings of their actions to authorities), but they can also have a positive effect on the cost of your home insurance.
Compare the Market’s Executive General Manager of General Insurance, Adrian Taylor, explains:
“Because smart home security devices like cameras, alarms and motion-activated lights can help reduce the risk of break-ins, burglary and other events, some home and contents insurers take that into account in their pricing,” Mr Taylor said.
“If you have specific types of home security tech, this can lower your premium somewhat. Your insurer will typically ask you questions about home security when you take out a new policy with them.
“Adding new home security tech is no guarantee that you’ll have cheaper home and contents insurance. Not all insurers weight that in so heavily, and even if you do add it in, there are a range of factors that influence insurance pricing, and the cost of your cover may still increase next time it’s up for renewal.
“However, the evidence these devices can provide can help you report the crime to the police and also assist as evidence of an insurance claim.
“If you do add home security devices, make sure you update your policy and let your provider know. Before buying, renewing or switching home and contents insurance it’s vital to also check the Product Disclosure Statement and Target Market Determination to learn all you need to know about a particular policy.”
To calculate the index, we assigned each country a score between 0 and 10 for each data point, with 10 being the best score and 0 being the worst. These three data point scores were then averaged to create an index score out of 10.
The sources and scoring system are detailed below:
References: