The Burrow

Jun 13, 2024
How long will we live?
Average life expectancy has gradually increased globally thanks to improved living standards, advances in medicine, and a reduction in child mortality rates.1 However, it’s longer for some countries than others.
As experts in helping Australians compare health insurance to support their health and wellbeing, we investigated which nations globally have most improved their average life expectancy age from birth since 1950, according to United Nations data.
Here’s what we found.
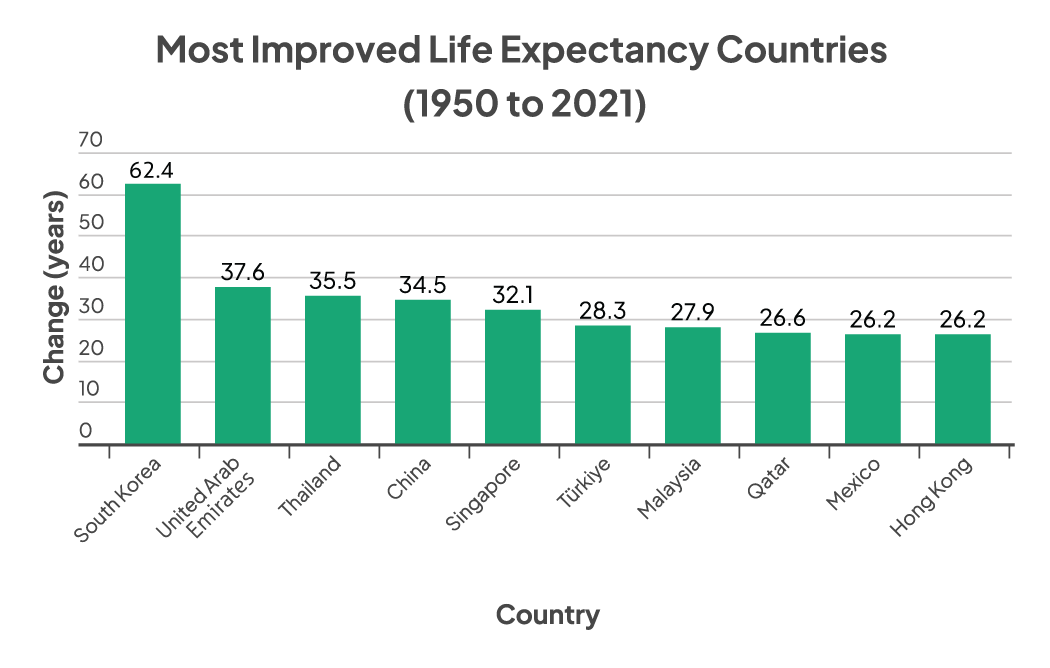

South Korea has most improved its life expectancy at birth with a jump of 62.4 years, according to United Nations World Population Prospects data.
South Korea had just a 21.3-year life expectancy for those born in 1950 – which has been significantly improved to 83.7 years at birth in 2021.
The rapid increase is mainly because the Korean War started in mid-1950 – which caused the average life expectancy to dip to a record low level – with about three million deaths caused and tens of thousands of casualties estimated.2,3
Despite the ramifications from the three-year war, South Korea has quickly rebounded to be the fifth-highest life expectancy country in 2021 in the study, with a reduction in the country’s infant mortality rate and cardiovascular diseases being contributing factors.4
The United Arab Emirates has improved its average life expectancy rate by 37.6 years in 71 years.
The UAE had a life expectancy of 41.1 years in 1950 – in contrast to 78.7 years in 2021.
This has been driven by economic, social and demographic change in the country – alongside the rise of government-led programs encouraging healthy lifestyles – but has been offset by an increase of chronic diseases, including cancers.5,6
Thailand has increased its life expectancy by 35.5 years since 1950.
The Southeast Asian country had an expected life longevity of 43.2 years in 1950, but this has since improved to 78.7 years in 2021.
Healthcare system reforms and social pensions have contributed to the increase, though the nation is now facing an ageing population due to reduced fertility rates.7
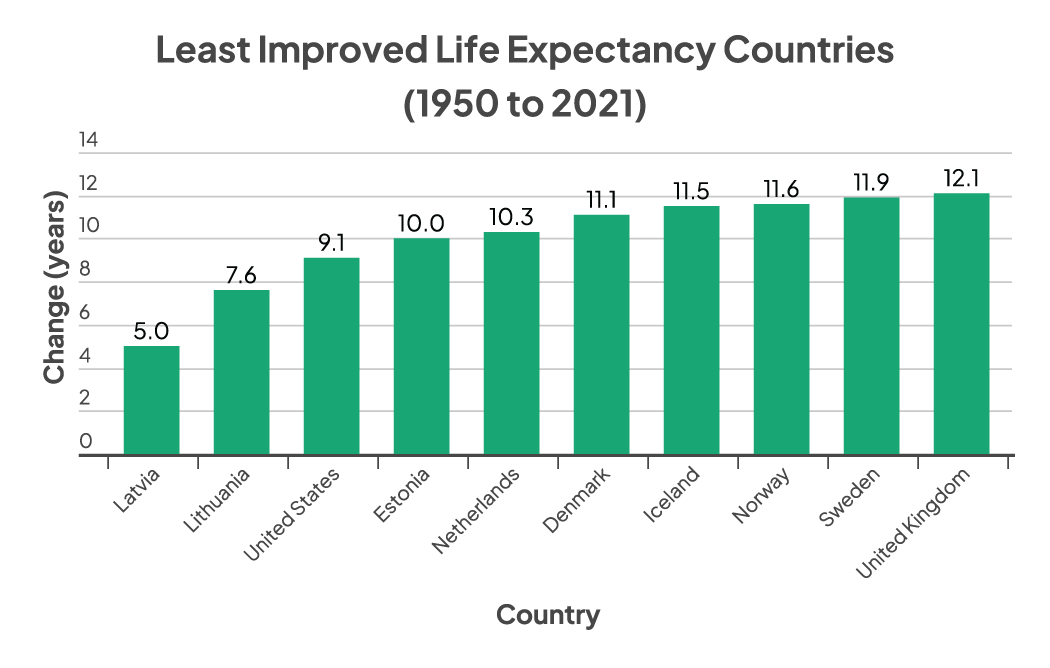

Latvia has only increased its average life expectancy by five years in a 71-year period.
The Northern European nation had a 68.6-year life expectancy at birth in 1950, which had grown to 73.6 years in 2021.
Gender, social and educational inequalities, the rising prevalence of chronic conditions – including the human immunodeficiency virus (HIV) – poor dietary habits, tobacco smoking and alcohol consumption were factors in its slow life expectancy change.8
Importantly, Latvia already started with relatively high life expectancy in 1950.
Lithuania has improved its life expectancy at birth by 7.6 years.
The European republic’s typical lifespan was 66.1 years in 1950, in comparison to 73.7 years in 2021.
This has been attributed to an increased rate of cardiovascular diseases and cancer cases, in addition to a higher-than-average life expectancy in 1950.9
The United States increased its life expectancy by 9.1 years in a 71-year period.
As one of the world’s most powerful states, Americans born in 1950 were expected to live 68.1 years on average, which improved to 77.2 years by 2021.
Its growth has been hampered by factors such as the COVID-19 pandemic, drug overdoses, and heart disease – in addition to a relatively high starting life expectancy in 1950.10
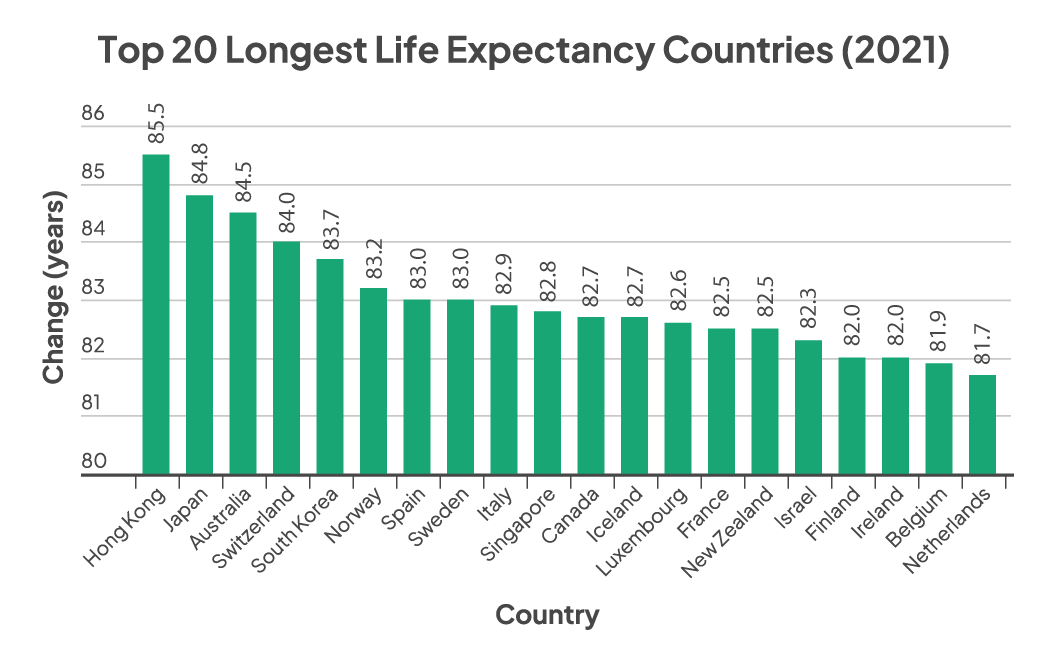
Hongkongers have the highest average life expectancy at birth at 85.5 years in 2021, according to the latest-available data.
The city ousted Japan – well known for its high wellbeing standards – by about eight months.
Australia was ranked third-best for life expectancy – ahead of Switzerland, South Korea and Norway.
Compare the Market’s Executive General Manager of Health, Steven Spicer, said there are a range of factors that can impact the life expectancy of individuals.
“How long you can live depends on a range of factors such as your upbringing, socioeconomic status, health habits, and even public policies that influence town planning, transport infrastructure and healthcare accessibility,” Mr Spicer said.
“Taking out a private health insurance policy can also help to support your health and wellbeing. A hospital policy, for example, can help you avoid often long public waiting lists for care. As a result, you may be able to access inpatient treatment sooner so you can get back on your feet.
“While an extras policy can help individuals keep up to date with various medical appointments and check-ups, such as dental and optical, which can improve your overall health and therefore contribute to a longer life expectancy.”
Data is accurate as of 28 March 2024 using United Nations data (via Our World in Data).
We studied the life expectancy at birth of all genders in 1950 and 2021 (latest-available data) across 54 countries.
Additional sources:
| Country | 1950 Life Expectancy at Birth (years) | 2021 Life Expectancy at Birth (years) | Improvement (years) |
| South Korea | 21.3 | 83.7 | 62.4 |
| United Arab Emirates | 41.1 | 78.7 | 37.6 |
| Thailand | 43.2 | 78.7 | 35.5 |
| China | 43.7 | 78.2 | 34.5 |
| Singapore | 50.7 | 82.8 | 32.1 |
| Türkiye | 47.7 | 76.0 | 28.3 |
| Malaysia | 47.0 | 74.9 | 27.9 |
| Qatar | 52.7 | 79.3 | 26.6 |
| Mexico | 44.0 | 70.2 | 26.2 |
| Hong Kong | 59.3 | 85.5 | 26.2 |
| Chile | 53.2 | 78.9 | 25.7 |
| Haiti | 37.5 | 63.2 | 25.7 |
| Japan | 59.2 | 84.8 | 25.6 |
| India | 41.7 | 67.2 | 25.5 |
| Taiwan | 55.7 | 81.0 | 25.3 |
| Colombia | 48.2 | 72.8 | 24.6 |
| Vietnam | 49.2 | 73.6 | 24.4 |
| Costa Rica | 53.8 | 77.0 | 23.2 |
| Slovak Republic | 57.8 | 80.7 | 22.9 |
| Portugal | 58.5 | 81.0 | 22.5 |
| Spain | 61.8 | 83.0 | 21.2 |
| Ghana | 43.1 | 63.8 | 20.7 |
| South Africa | 43.5 | 62.3 | 18.8 |
| Finland | 64.2 | 82.0 | 17.8 |
| Fiji | 49.5 | 67.1 | 17.6 |
| Poland | 59.1 | 76.5 | 17.4 |
| Italy | 65.7 | 82.9 | 17.2 |
| Nigeria | 35.8 | 52.7 | 16.9 |
| Austria | 64.8 | 81.6 | 16.8 |
| Ireland | 65.6 | 82.0 | 16.4 |
| Luxembourg | 66.4 | 82.6 | 16.2 |
| France | 66.4 | 82.5 | 16.1 |
| Belgium | 66.3 | 81.9 | 15.6 |
| Australia | 69.0 | 84.5 | 15.5 |
| Switzerland | 68.9 | 84.0 | 15.1 |
| Canada | 68.2 | 82.7 | 14.5 |
| Slovenia | 60.8 | 74.9 | 14.1 |
| Israel | 68.2 | 82.3 | 14.1 |
| Germany | 66.8 | 80.6 | 13.8 |
| Greece | 66.4 | 80.1 | 13.7 |
| Czechia | 64.4 | 77.7 | 13.3 |
| New Zealand | 69.3 | 82.5 | 13.2 |
| Hungary | 62.1 | 74.5 | 12.4 |
| Russia | 57.2 | 69.4 | 12.2 |
| United Kingdom | 68.6 | 80.7 | 12.1 |
| Sweden | 71.1 | 83.0 | 11.9 |
| Norway | 71.6 | 83.2 | 11.6 |
| Iceland | 71.2 | 82.7 | 11.5 |
| Denmark | 70.3 | 81.4 | 11.1 |
| Netherlands | 71.4 | 81.7 | 10.3 |
| Estonia | 67.1 | 77.1 | 10.0 |
| United States | 68.1 | 77.2 | 9.1 |
| Lithuania | 66.1 | 73.7 | 7.6 |
| Latvia | 68.6 | 73.6 | 5.0 |