The Burrow

Aug 27, 2024
Buying a car can be difficult – but the majority of Australians are loyal to a handful of the best-selling models.
As car insurance comparison experts, we delved into our database to find out the most popular new and used vehicle models that Australians have compared for a car insurance policy.
Specifically, we identified trends among different age groups, including vehicle models, exterior colour, and fuel type preferences.
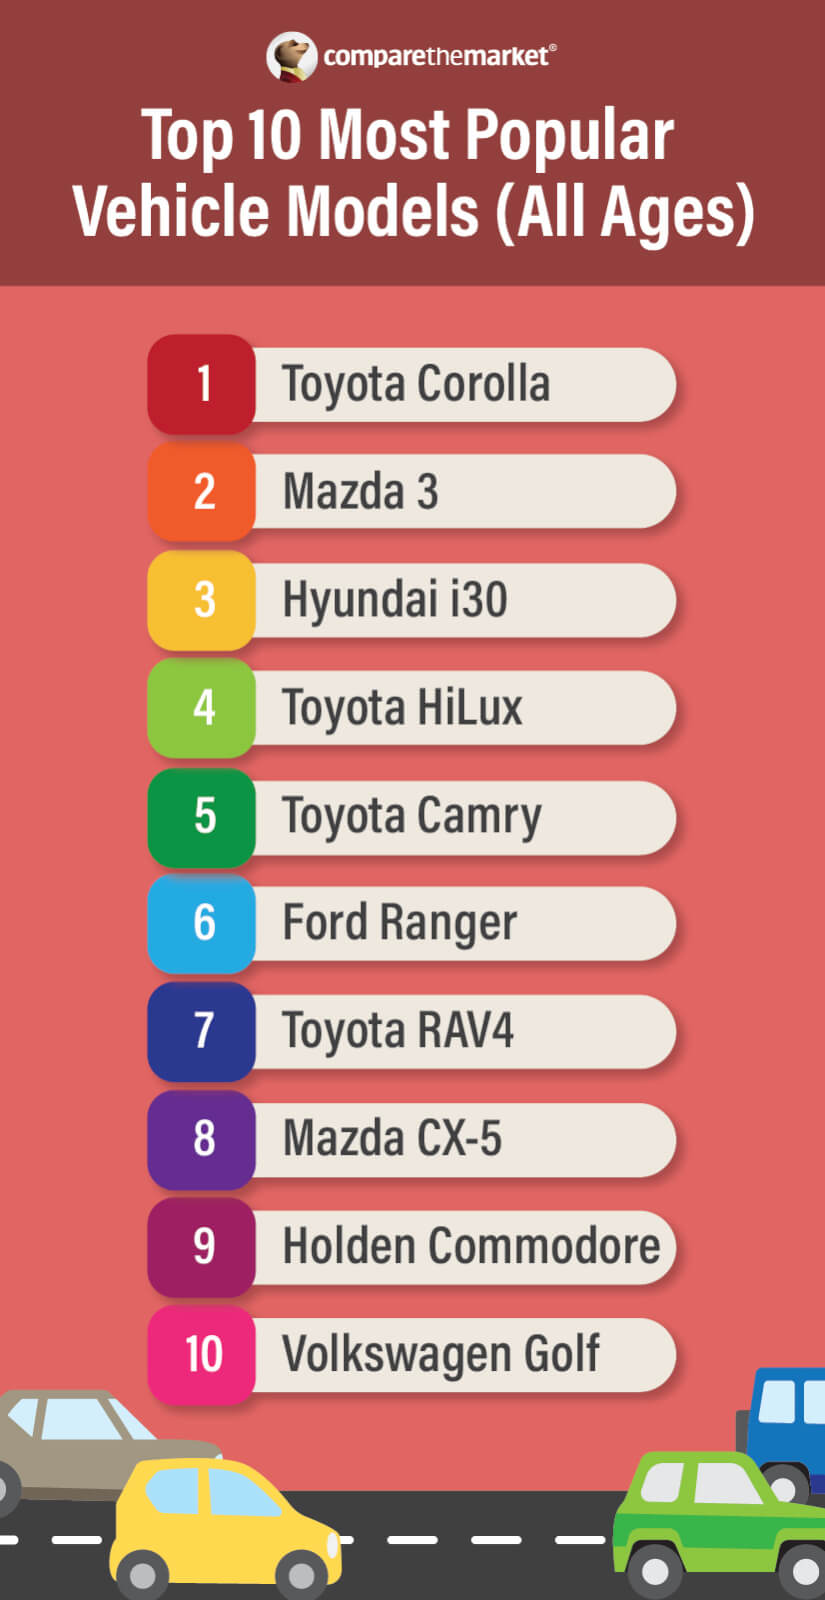
Of the top 20 most compared vehicles on Compare the Market, these were the key highlights:
| Rank | Make & Model | Proportion of Car Insurance Comparisons (out of Top 20) |
| 1 | Mazda 3 | 10.35% |
| 2 | Hyundai i30 | 10.09% |
| 3 | Toyota Corolla | 9.89% |
| 4 | Toyota HiLux | 7.96% |
| 5 | Holden Commodore | 5.75% |
| 6 | Volkswagen Golf | 5.27% |
| 7 | Mitsubishi Lancer | 4.54% |
| 8 | Toyota Camry | 4.44% |
| 9 | Ford Falcon | 4.35% |
| 10 | Ford Ranger | 4.32% |
| 11 | Nissan Navara | 4.03% |
| 12 | Honda Civic | 3.60% |
| 13 | Kia Cerato | 3.54% |
| 14 | Mazda 2 | 3.29% |
| 15 | Ford Focus | 3.24% |
| 16 | Subaru Impreza | 3.21% |
| 17 | Mitsubishi Triton | 3.20% |
| 18 | Suzuki Swift | 3.07% |
| 19 | Toyota Yaris | 3.00% |
| 20 | Mazda CX-3 | 2.87% |
| Rank | Make & Model | Proportion of Car Insurance Comparisons (out of Top 20) |
| 1 | Toyota Corolla | 10.71% |
| 2 | Mazda 3 | 9.69% |
| 3 | Hyundai i30 | 7.68% |
| 4 | Toyota Camry | 7.13% |
| 5 | Toyota HiLux | 6.27% |
| 6 | Ford Ranger | 5.56% |
| 7 | Toyota RAV4 | 5.03% |
| 8 | Mazda CX-5 | 4.94% |
| 9 | Volkswagen Golf | 4.51% |
| 10 | Mitsubishi Outlander | 4.23% |
| 11 | Mitsubishi Triton | 3.68% |
| 12 | Hyundai Tucson | 3.64% |
| 13 | Nissan X-Trail | 3.55% |
| 14 | Honda Civic | 3.54% |
| 15 | Toyota Yaris | 3.43% |
| 16 | Holden Commodore | 3.36% |
| 17 | Nissan Navara | 3.33% |
| 18 | Kia Cerato | 3.28% |
| 19 | Toyota Prado | 3.26% |
| 20 | Mitsubishi ASX | 3.19% |
| Rank | Make & Model | Proportion of Car Insurance Comparisons (out of Top 20) |
| 1 | Toyota Corolla | 9.10% |
| 2 | Mazda 3 | 6.98% |
| 3 | Toyota Camry | 6.49% |
| 4 | Ford Ranger | 6.42% |
| 5 | Toyota RAV4 | 6.11% |
| 6 | Mitsubishi Outlander | 5.93% |
| 7 | Toyota HiLux | 5.88% |
| 8 | Mazda CX-5 | 5.46% |
| 9 | Nissan X-Trail | 5.40% |
| 10 | Toyota Kluger | 5.39% |
| 11 | Hyundai i30 | 4.88% |
| 12 | Toyota Prado | 4.80% |
| 13 | Holden Commodore | 3.65% |
| 14 | Mitsubishi Triton | 3.60% |
| 15 | Volkswagen Golf | 3.46% |
| 16 | Nissan Navara | 3.45% |
| 17 | Honda CR-V | 3.43% |
| 18 | Hyundai Tucson | 3.34% |
| 19 | Mazda CX-9 | 3.31% |
| 20 | Toyota LandCruiser | 2.91% |
| Rank | Make & Model | Proportion of Car Insurance Comparisons (out of Top 20) |
| 1 | Toyota Corolla | 9.60% |
| 2 | Mazda 3 | 7.86% |
| 3 | Toyota HiLux | 7.29% |
| 4 | Ford Ranger | 7.05% |
| 5 | Hyundai i30 | 6.67% |
| 6 | Toyota RAV4 | 5.59% |
| 7 | Holden Commodore | 5.10% |
| 8 | Toyota Camry | 4.91% |
| 9 | Mazda CX-5 | 4.42% |
| 10 | Volkswagen Golf | 4.37% |
| 11 | Toyota Prado | 4.36% |
| 12 | Mitsubishi Triton | 4.29% |
| 13 | Nissan X-Trail | 4.27% |
| 14 | Nissan Navara | 4.02% |
| 15 | Toyota Kluger | 3.80% |
| 16 | Toyota LandCruiser | 3.65% |
| 17 | Mitsubishi Outlander | 3.47% |
| 18 | Ford Falcon | 3.27% |
| 19 | Honda CR-V | 3.06% |
| 20 | Hyundai Tucson | 2.93% |
| Rank | Make & Model | Proportion of Car Insurance Comparisons (out of Top 20) |
| 1 | Toyota Corolla | 10.51% |
| 2 | Mazda 3 | 8.15% |
| 3 | Ford Ranger | 7.05% |
| 4 | Toyota HiLux | 6.94% |
| 5 | Hyundai i30 | 6.70% |
| 6 | Toyota RAV4 | 6.29% |
| 7 | Toyota Camry | 5.17% |
| 8 | Holden Commodore | 4.94% |
| 9 | Mazda CX-5 | 4.84% |
| 10 | Toyota LandCruiser | 4.30% |
| 11 | Mitsubishi Triton | 3.98% |
| 12 | Ford Falcon | 3.88% |
| 13 | Nissan X-Trail | 3.73% |
| 14 | Toyota Prado | 3.64% |
| 15 | Nissan Navara | 3.58% |
| 16 | Volkswagen Golf | 3.47% |
| 17 | Mitsubishi ASX | 3.34% |
| 18 | Subaru Forester | 3.18% |
| 19 | Kia Cerato | 3.17% |
| 20 | Mercedes-Benz C-Class | 3.14% |
| Rank | Make & Model | Proportion of Car Insurance Comparisons (out of Top 20) |
| 1 | Toyota Corolla | 12.67% |
| 2 | Mazda 3 | 7.98% |
| 3 | Hyundai i30 | 7.21% |
| 4 | Toyota RAV4 | 6.63% |
| 5 | Toyota Camry | 6.04% |
| 6 | Mazda CX-5 | 5.40% |
| 7 | Subaru Forester | 4.28% |
| 8 | Toyota HiLux | 4.20% |
| 9 | Ford Ranger | 4.17% |
| 10 | Toyota LandCruiser | 4.13% |
| 11 | Kia Cerato | 4.06% |
| 12 | Mercedes-Benz C-Class | 3.93% |
| 13 | Holden Commodore | 3.91% |
| 14 | Nissan X-Trail | 3.90% |
| 15 | Ford Falcon | 3.88% |
| 16 | Mitsubishi ASX | 3.84% |
| 17 | Honda CR-V | 3.49% |
| 18 | Mazda 2 | 3.43% |
| 19 | Toyota Yaris | 3.42% |
| Hyundai Tucson |
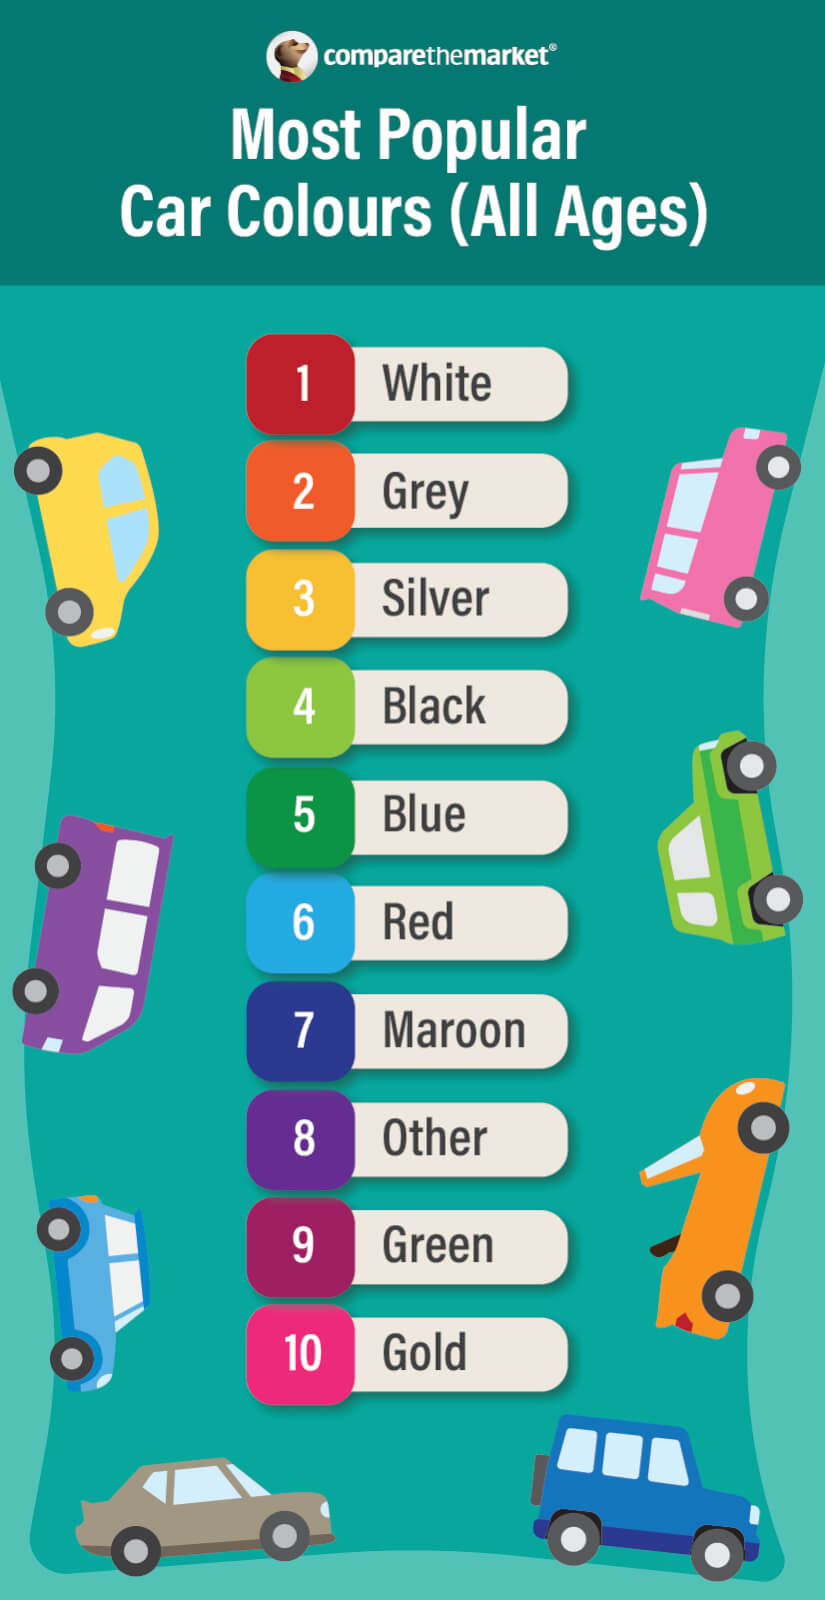
According to Australians who have compared car insurance policies through Compare the Market, car colour preferences were similar across all age groups:
In line with new car sales data, Australians across all age groups mostly had the same vehicle powertrain preferences:1
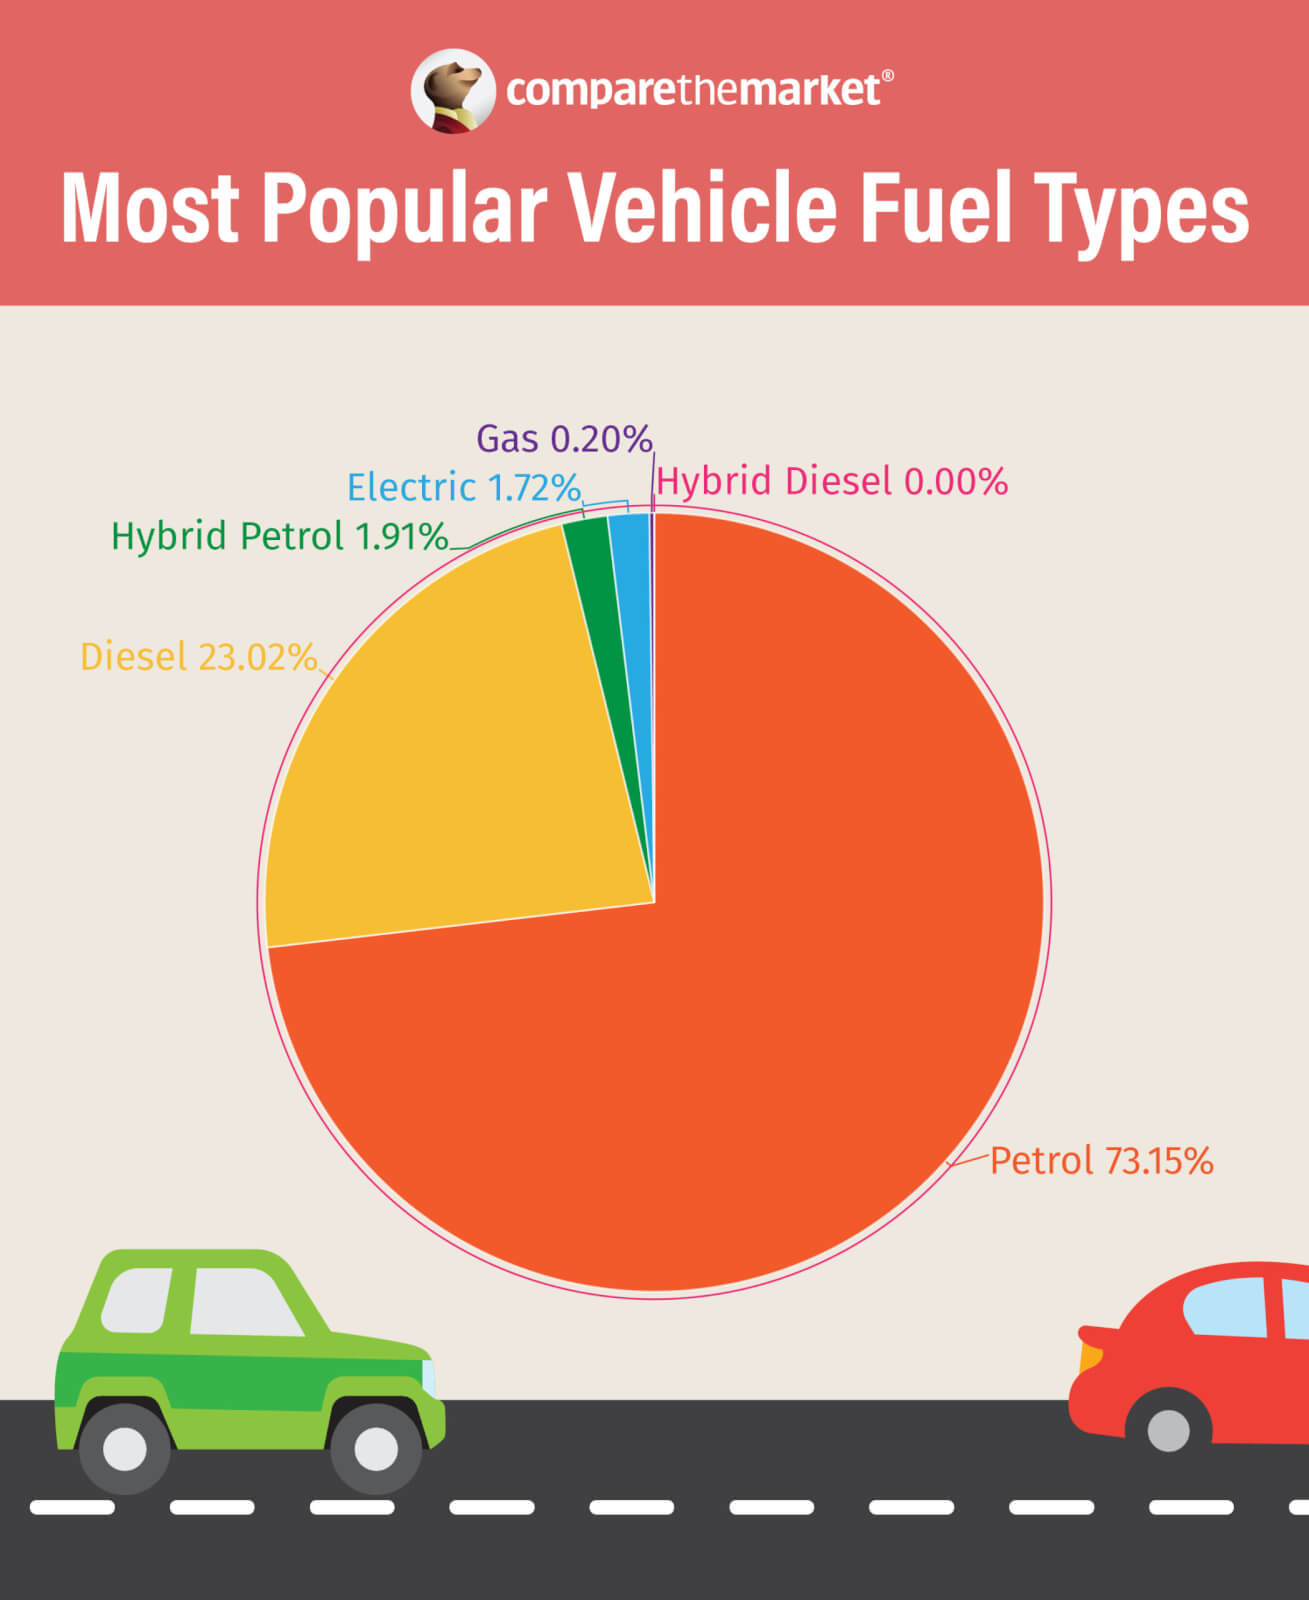
Note: Hybrid car data includes plug-in hybrid electric vehicles (PHEVs). Gas means liquefied petroleum gas (LPG) vehicles.
Compare the Market’s Executive General Manager of General Insurance, Adrian Taylor, said the type of vehicle you choose to drive is one factor that impacts the price of car insurance premiums.
“Beyond the purchase price, car insurance is a key ownership cost to factor in when buying any vehicle,” Mr Taylor said.
“As a growing number of new and used car buyers trend towards SUVs and utes, it’s important to keep in mind that car insurance premiums are generally higher for these larger vehicles, luxury cars, and hybrid and full electric models, in addition to other factors.
“For example, while black was among the most popular car paint colours, our research has found it to be the most expensive to cover as some insurers apply a ‘colour premium’ to policies – in contrast to white and other lighter colours.
“No matter what vehicle you own, it’s important to compare what’s on offer to potentially find a better deal, switch and not pay a cent more than you need to – rather than staying loyal to the same insurer year-on-year.”
Always read the Product Disclosure Statement (PDS) and Target Market Determination (TMD) to check for the inclusions, limits and restrictions before purchasing.
Data includes Australians who have quoted and compared car insurance policies through Compare the Market between 1 July 2023 to 1 July 2024.
Additional sources: