The Burrow

Oct 10, 2024
Buying a new car can be exciting. Behind all the shiny finishes and fancy features, it can be hard to really see what you’re buying, especially when buying for your whole family. From safety to reliability and general maintenance costs, understanding the strengths and weaknesses of the car models you’re browsing is important.
According to the Australian Federal Chamber of Automotive Industries, in the first six months of 2024 alone, total sales of new vehicles in Australia equalled to 632,412, which represents an 8.7 per cent increase over the previous record of 605,522 during 2018.1
As car insurance comparison experts, we were interested to see which of some of the most popular cars on the market are the best for young families.
To do this, we’ve looked at a range of the most popular cars across Australia, the United States of America and Europe, and indexed them against a variety of different factors, including estimated repair costs over a number of years and Australasian New Car Assessment Program (ANCAP) safety scores.
Here’s what we found.
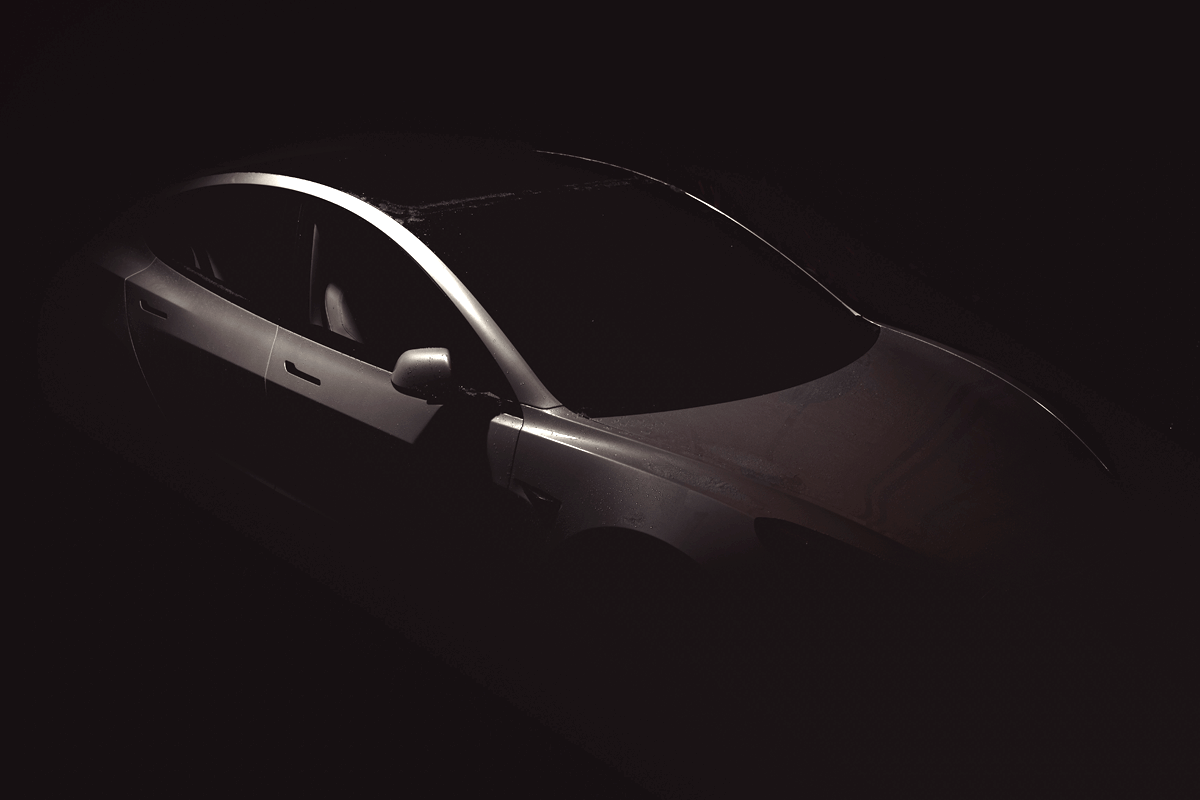
Taking the top spot in our list is the Tesla Model 3. Ranking highly across all metrics and excelling at Safety Assist, the electric sedan is a good option for young families.
Despite an average baseline annual maintenance cost of AU$378, the Model 3 provides excellent ongoing reliability, boasting the second lowest 10-year major repair probability at 13.45%.
In a trend shown by our dataset, Tesla cars tend to score highly within ANCAP safety ratings, especially Safety Assist, and the Model 3 is no exception. With an Adult Occupant Protection score equal to that of the Toyota Corolla, the Model 3 sits comfortably on our list as the highest placement of a car with a price point of higher than AU$50,000.
Finally, being a fully electric vehicle with no traditional engine, the Model 3 excelled with storage space, boasting an impressive 594L across its’ spaces.
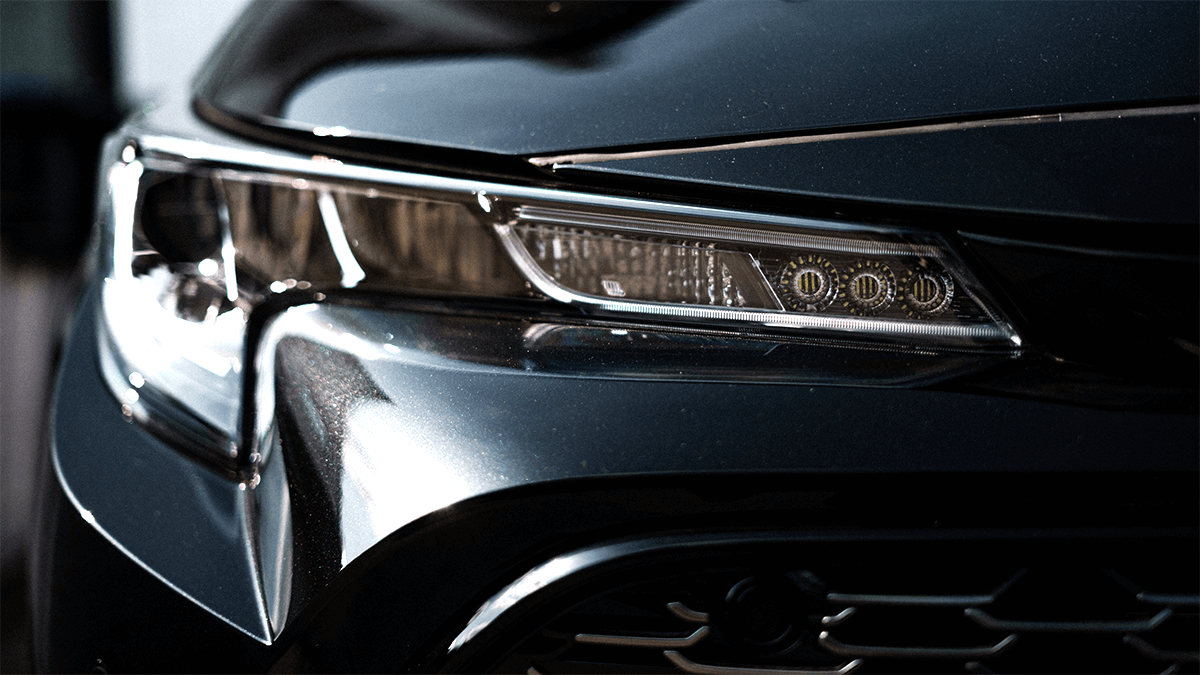
Pulling in at tied second on our list is the Toyota Corolla. The Corolla’s low maintenance costs and high reliability makes it a fantastic choice for young families looking to purchase a new car.
With an estimated annual cost at 10 years of AU$936 – the second lowest in our study – and a 10-year major repair probability of 11.89%, the Corolla makes for a cost-effective option.
In comparison to other car models on this list, the Corolla actually scores a little lower in total ANCAP ratings, owed primarily to a rating of 83% in Child Occupant Protection and 76% in Safety Assist. The Corolla’s Adult Occupant Protection and Vulnerable Road User Protection scores, at 96% and 86% respectively, helped to keep the Corolla in second spot.
The Corolla features a boot storage space of 470L, which while impressive for a sedan, lags behind its’ SUV competitors.
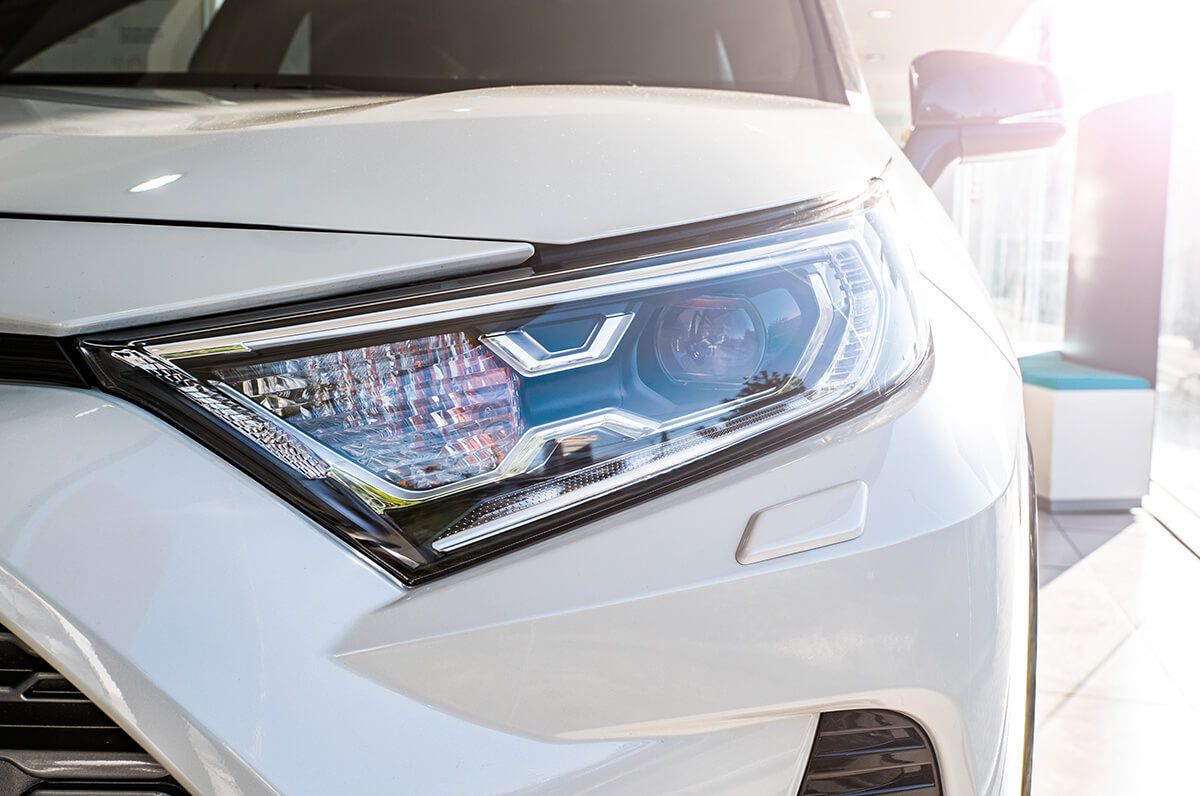
Toyota’s second entry on this list and tied for second overall is the RAV4. Landing as the highest placed SUV on our list, the RAV4 boasts above average scores across the metrics we looked at.
As of writing, the RAV4 is the second best-selling SUV in the United States.2 The relatively low ongoing maintenance costs across 10 years make this a cost-effective choice for those looking to break into the SUV market.
The RAV4 also excelled in ANCAP’s safety ratings, landing above average across all four safety metrics, with Vulnerable Road User Protection in particular being a winning metric when compared against other models, at 85%.
The RAV4’s above average boot storage capacity lends itself to its’ high placement, offering 542L worth of space with the back seats still in place.
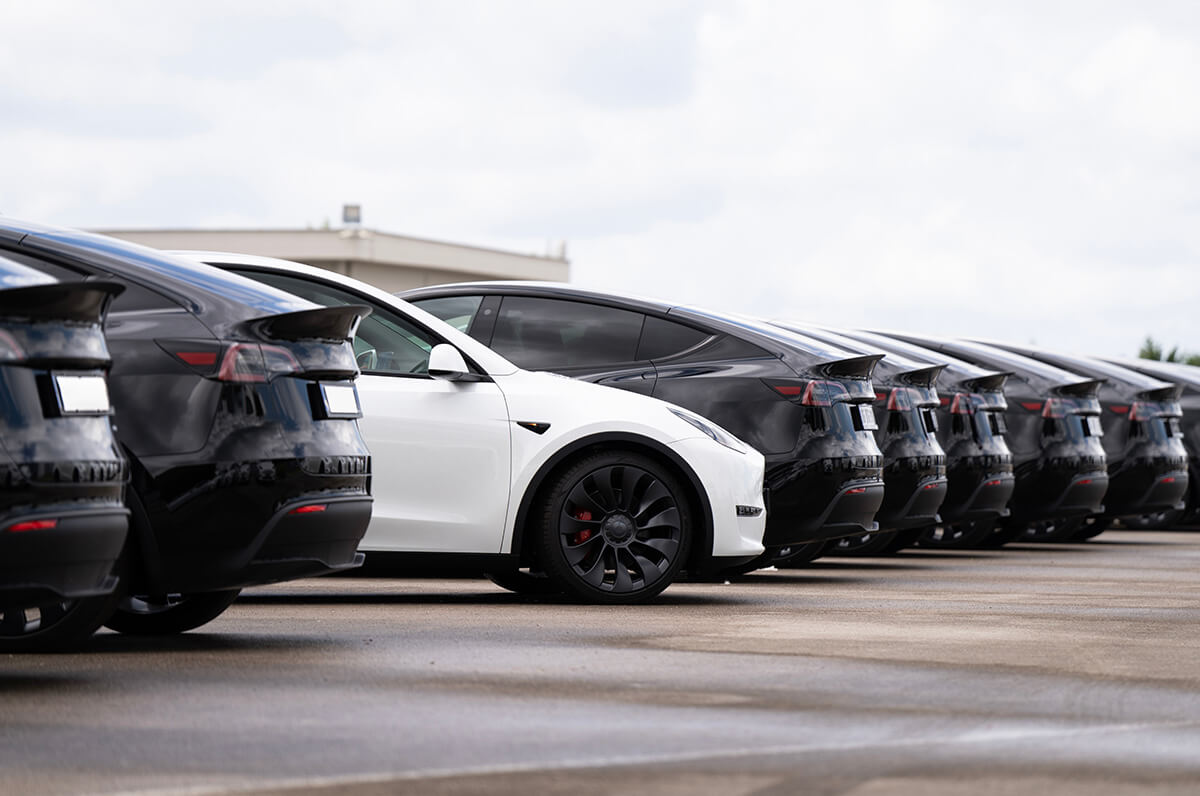
Tesla’s premiere SUV variant, the Model Y, takes a special spot in our list ranking as the fourth highest in total, and also taking the top spot in safety.
This electric SUV dominated our index for ANCAP safety, placing first in Safety Assist with a rating of 98%. In addition, the Model Y parked in at third on our index for Adult Occupant Protection, with above average rankings in Child Occupant Protection and Vulnerable Road User Protection.
Starting from , the Model Y comes at a higher price point than many of the cars on our list, but with this premium comes peace of mind. The Model Y’s long-term maintenance costs were also cheaper than the average, with an estimated annual cost at 10 years being AU$1,505.
Similarly to the Model 3, the Model Y’s lack of a traditional engine allows for a far above average storage capacity at 971L.
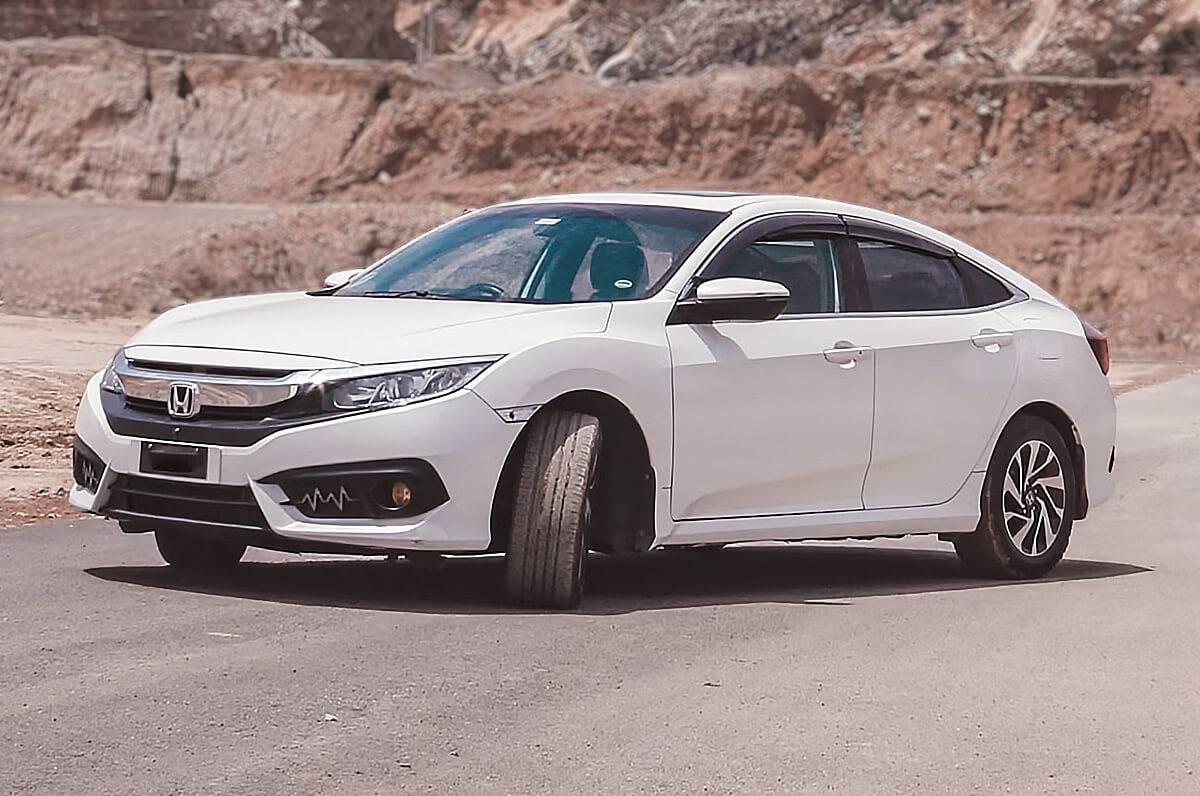
Finally, in fifth position on our list is the Honda Civic. A staple of Honda’s vehicle lineup since 1972, the Civic earns its spot as a consistently reliable vehicle with above average ANCAP safety scores.3
Starting with an estimated annual cost for the first year at AU$347, the Civic maintains this low cost across each of our data points, consistently landing as fifth-best in terms of major repair probability.
In terms of ANCAP safety, the Civic placed above average across Child Occupant Protection, Vulnerable Road User Protection and Safety Assist, while its 89% score within Adult Occupant Protection was below average across the vehicles we examined.
Where the Civic struggled with its’ competitors was storage space, sporting a below average 410L boot space.
For young families primarily interested in being cost effective, the Toyota Yaris Cross is your pick.
While ANCAP performance is below the other cars examined in this study, the Yaris Cross was a clear winner when it came to maintenance costs and repair probability.
With a starting annual cost of AU$250, the Yaris Cross’ estimated annual costs only rise to an estimated mere AU$931 at the 10-year mark – a substantially lower estimation than its competition. The same can be said for major repair probabilities, in which the Yaris Cross easily ties in first with the Toyota Corolla at 11.89% for 10 years, surpassing even the closest car models by almost 4%.
However, the Yaris Cross tended to have weaker ANCAP safety rating performance. Across the Adult Occupant Protection and Child Occupant Protection metrics, the compact SUV tended to score lower than the other cars we studied, with both at an 86% rating.
| Make and Model | Total Maintenance Index Score | Total ANCAP Index Score | Total No. of Seats | Boot Storage (L) | Total Average Score |
| Tesla Model 3** | 9.15 | 5.75 | 5 | 594 | 7.64 |
| Toyota Corolla | 9.85 | 4.92 | 5 | 470 | 7.44 |
| Toyota RAV4 | 8.04 | 7.04 | 5 | 542 | 7.44 |
| Tesla Model Y | 6.77 | 8.25 | 5 | 971 | 7.33 |
| Honda Civic | 8.69 | 6.13 | 5 | 410 | 7.11 |
| Lexus ES | 8.95 | 5.00 | 5 | 454 | 6.98 |
| Toyota Yaris Cross | 10.00 | 3.71 | 5 | 390 | 6.91 |
| Toyota Highlander | 7.83 | 4.92 | 7 | 583 | 6.82 |
| Toyota C-HR | 8.34 | 5.30 | 5 | 388 | 6.58 |
| Lexus RX | 5.76 | 7.50 | 5 | 612 | 6.55 |
Maintenance Total is aggregate of six factors: Estimated Annual Cost (1Y), Major Repair Probability (1Y), Estimated Annual Cost (5Y), Major Repair Probability (5Y), Estimated Annual Cost (10Y), Major Repair Probability (10Y).
ANCAP Total is aggregate of four factors: Adult Occupant Protection, Child Occupant Protection, Vulnerable Road User Protection, Safety Assist.
** Indicates an out-of-date ANCAP rating (as of December 2023).
To view the full dataset, click here.
Compare the Market’s Executive General Manager of General Insurance, Adrian Taylor, notes the importance of considering car insurance premiums when shopping for new cars.
“Buying a new car can be an exciting time, but beyond the purchase price, it’s important to remember to factor in car insurance,” Mr Taylor said.
“With SUVs largely emerging as the family vehicle of choice, it’s easy to forget that these types of vehicles generally demand higher car insurance premiums.
“Other model types such as hybrid and electric can also bring with them different insurance premiums.
“Reliability also plays an important part in car insurance premiums, with more reliable models often seeing lower premiums than models more likely to break down.
“No matter which vehicle you buy or own, it’s always important to regularly compare your insurance to look for a policy that suits you and your family’s circumstances.”
Always read the Product Disclosure Statement (PDS) and Target Market Determination (TMD) to check for the inclusions, limits and restrictions before purchasing.
Sales records detailing the most-sold cars across Europe, the United States, and Australia in 2023 and 2024 year-to-date were used as a reference for cars selected for the index.
CarEdge’s vehicle maintenance cost index was used for ‘Maintenance Total’ index factors with an expected annual milage of 12,000:
ANCAP’s safety database was used for ‘ANCAP Total’ index factors:
Along with the total number of seats within the base model of each vehicle, these factors were then indexed and averaged into the final ‘total score’.
CarsGuide’s (CarandDriver when CarGuide was non-applicable) individual model price points and boot space were used for each model. Boot space is recorded with back seats upright.
Lexus RX maintenance costs and repair probability averaged across RX350 and RX450h models.
Additional Sources